Investors don't need millions of pounds, access to hedge funds or years of knowledge and expensive qualifications to make more money. Many could greatly increase their returns simply by buying more shares. Holding too few shares is the single biggest mistake most investors make. The one factor that differentiated older, richer and more sophisticated investors was that they increased returns by holding more shares, a behavioural investment study by Goetzmann and Kumar of over 60,000 US stock holding households found. The data showed over 60 per cent of households held three shares or fewer, greatly increasing their risks.
Diversify, diversify, diversify
How many shares should investors hold in their portfolio? The simple answer is 15. As investors increase shares from one to 15, each additional share greatly reduces the risk of underperforming the market. But after 15 shares the reduction in risk becomes so small that it is questionable whether it outweighs all the extra effort and research going into the investment case. Returns are also diluted, such that even if the share turns out to be a ten-bagger the benefit to the portfolio will be hardly worth the effort. Risk Reduction and Portfolio Diversification: An Analytical Solution by Edwin Elton and Martin Gruber (Journal of Business, 1977) show the benefits (see chart, below).
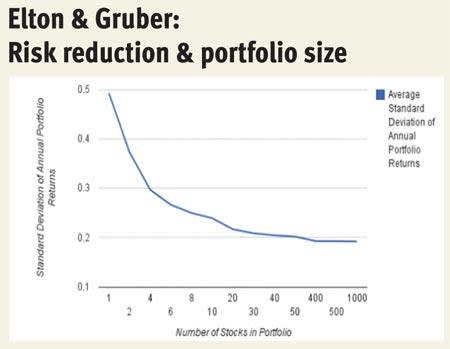
But it isn't just mathematics that suggests 15 as the perfect number of shares for an equity portfolio. The godfather of value investing, Benjamin Graham, wrote in his seminal 1949 book, The Intelligent Investor, that adequate diversification can be achieved with 10 to 30 stocks. Warren Buffett, himself a protégé of Graham, holds 73 per cent of his portfolio in just five stocks and 90 per cent in 15 stocks, according to the most recent regulatory filings. US hedge fund manager Seth Klarman, who is feted as the heir apparent to the 'king of value' crown, holds 21 stocks in his portfolio and thinks the ideal number is 15.
Opposites attract
It is important to ensure those 15 shares don't all move in the same direction, so attention to the spread of shares across industry sectors in your portfolio is essential. Portfolios can become heavily weighted to a particular sector or investment story that becomes 'hot', such as technology in early 2000 or financials in 2007. This could lead to a situation where unbeknownst to the investor the risk has become very concentrated.
I shudder to think even now of a conversation I had with a family friend and private investor in 2007 who assured me he was well diversified owning shares in Lloyds TSB, RBS and Barclays. Such a portfolio, of course, would have suffered heavily during the credit crisis - equally, avoiding banking stocks in its aftermath for fear of further losses would have meant missing out on a major rally since 2009. Balanced exposure is a better approach.
There are, however, no hard and fast rules for sector diversification, and sector exposures will need to shift - to capture a particular phase in the economic cycle such as a recovery, for example, investors will want to increase allocation to cyclical areas such as industrials and consumer goods. Conversely, in a downturn moving towards utilities and healthcare makes sense - although trying to time cyclicality-based sector rotation also brings its own risks.
As a general rule try not to have more than 30 per cent of your equity portfolio in any one sector and, if you don't have any shares in a particular sector, it might be time to ask why.
Industrial sector weightings
| FTSE All-Share | Invesco Perpetual High Income | BlackRock UK Special Situations | Marlborough Special Situations | MSCI World | |
|---|---|---|---|---|---|
| Oil & Gas | 15% | 0% | 14% | 7% | 12% |
| Basic Materials | 10% | 0% | 12% | 5% | 7% |
| Industrials | 9% | 20% | 24% | 31% | 11% |
| Consumer Goods | 14% | 21% | 9% | 3% | 10% |
| Health Care | 7% | 35% | 5% | 4% | 11% |
| Consumer Services | 10% | 2% | 5% | 21% | 11% |
| Telecommunications | 6% | 5% | 4% | 3% | 4% |
| Utilities | 4% | 8% | 0% | 1% | 4% |
| Financials | 24% | 8% | 19% | 9% | 18% |
| Technology | 2% | 0% | 8% | 16% | 12% |
| 100% | 101% | 100% | 100% | 100% |
Home disadvantage
In sports, playing at home is an advantage, but in investing having a home bias seriously damages your returns and increases your risk. The benefits of international diversification are indisputable - if the global economy has taught investors anything since 2008 it is that the fortunes of different nations do not always move together. As a recent MSCI report emphatically stated: "As asset growth is the main objective of equity allocation, biasing it towards the domestic market may come with potentially huge opportunity costs. In this new paradigm, the full equity opportunity set spans the globe and is the natural starting point for equity allocation." Yet investors still hold the majority of their wealth in domestic assets.
Even worse is that the main reason for holding assets at home is investor delusion on future returns. UK investors' portfolio bias could only be explained if they expected home markets to outperform the US by 5.0 per cent, a frightening behavioural study by French and Poterba showed. This, of course, would be like placing money in a savings account paying 0.01 per cent purely on the basis that you believe it will pay 5.0 per cent rather than any evidential basis that it would.
The report also found that the home bias was exacerbated by investors being far too pessimistic about returns on foreign markets as they carried some extra 'risk' which simply doesn't exist. Other explanations for investors sticking with domestic equities include perceptions of higher dealing costs or a lack of governance, but these have also proved to be unfounded. Modern electronic trading and custody has greatly reduced costs in the core markets of UK, US, Europe and Japan and governance is comparable across blue-chip indices.
The biggest concern is an asset and liability mis-match for UK pensioners - the fear that US dividends will fail to cover UK heating bills - but a study by MSCI states clearly that: "Domestic equities have demonstrated that they provide no better link to domestic pension liabilities than global equities." In fact, the opposite may be true as UK companies cut dividends in a triple-dip economy while emerging market growth pushes gas prices and heating bills higher.
The problem of home bias has improved - in the UK alone it has fallen from 75.9 per cent in 1997 to 51.6 per cent in 2010, the MSCI report reveals. This is happening organically as UK companies expand overseas operations - drinks group Diageo, for example, generates 42 per cent of net sales overseas and banks such as HSBC generated all their pre-tax profits overseas after its UK operations slumped to a loss.
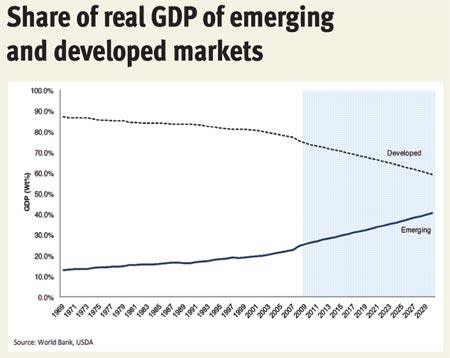
But the UK home bias is still at odds with the position of the UK in the modern global economy and is only set to get worse in the future - and gaining international exposure through global UK equities can only take you so far. Emerging market economies remain on an upward trajectory - over more than 40 years the real GDP share for emerging countries has more than doubled from 12 per cent in 1969 to over 25 per cent in 2012, and by 2030 the emerging market GDP weighting is forecast to rise to over 40 per cent (see chart: 'Share of real GDP of emerging and developed markets, history and projections', below). If investors have little or, even worse, no exposure to these markets they will be damaging returns for no good reason.
The two fundamental approaches by which global equity portfolios are balanced provide an instructive insight into why investors need to expand their horizons. One method is GDP weighting – the economic output of a country; the second is market capitalisation weighting – the size of a country's stock market. A criticism levelled at the market-weighted index is that it exposes investors to market bubbles such as Japan in 1989 and the US in 2007. Again, we favour a balanced approach as shown in the table below (country weightings), although we lean towards the GDP weighting.
Country weightings
| MSCI alternative GDP weighting | MSCI alternative market cap weighted | IC suggestions | |
|---|---|---|---|
| China | 10% | 2% | 5% |
| Japan | 11% | 9% | 5% |
| Asia | 6% | 5% | 5% |
| UK | 4% | 9% | 25% |
| North America | 28% | 50% | 30% |
| Europe | 36% | 23% | 25% |
| Africa | 1% | 1% | 1% |
| Latin America | 5% | 2% | 4% |
| 100% | 100% | 100% |
However, both methods demonstrate that investors who hold over 50 per cent in domestic assets are underweight overseas (see 'Country weightings' table, above). We wouldn't recommend any drastic portfolio changes, but an annual or quarterly review would offer the perfect opportunity to ask some hard questions about whether you really have correct weightings to some of the biggest economies in the world, including Japan, the US, Germany and France.
Passive or active?
"It's urgent that people wake up," said John C Bogle, founder of multi-billion dollar tracker fund company Vanguard, in an interview with the New York Times. He thinks investors are facing some of the most difficult conditions that he has seen in over 60 years in the markets. Returns will be harder to come by and lower than historical averages, meaning, according to Mr Bogle, that it's vital investors save every basis point they can. Mr Bogle does, of course, have a vested interest in saying this: his business, Vanguard, provides low-cost tracker funds. But vehicles like these highlight that gaining equities exposure doesn't have to be time consuming. Passive investing can be achieved through a mixture of tracker funds offering exposure along the lines we have mentioned above. These tracker funds will simply replicate chosen market returns, at a lower cost than expensive actively managed funds.
Those investors with more time on their hands who want to reduce fees further still or who think they can outperform the market can match tracker funds that increase overseas exposure in markets where they don't feel they have the expertise with individual stocks. Such diversification could bring a few more valuable points of alpha. A behavioural investing study by Goetzmann and Kumar found that the annual outperformance of risk-adjusted returns between the least and most diversified portfolios is 2.4 per cent. The difference widens the older you get. Investors in the over 65 group who were well diversified outperformed their low diversification peers by 3.12 per cent a year.
Income or growth?
Income or growth is a dangerous way of looking at investing as this often means investors get their risk profile wrong. Retirees often slavishly focus on generating income from investment but this leaves them wide open to the creeping evil of inflation and/or concentration in certain sectors like banking. The Office of National Statistics' latest figures for England and Wales give the most common age of death as 85 for men and 89 for women. Over the past 50 years (1960-2010) the average lifespan has increased by around 10 years for a man and 8 years for a woman.
So take a retirement age of 66 as an example and this gives you an investment horizon of 19 and 23 years respectively for men and women. Over that timescale more risk can be taken as markets will bounce back, the two most recent market corrections in 2000 and 2007 both took around five years to recover lost ground. The opposite is often true of younger investors who may be exposing themselves to too much risk. This is a common mistake of applying the tired investment philosophy of '100 minus age' for an equity weighting. But if the money is being invested for a deposit on a house investors can ill afford losses of up to 40 per cent as it is unlikely they will be able to wait the five years for the recovery.
Investors need to carefully work out what they need the money to achieve in the future and then, crucially, they need to be honest with themselves about an expected or required return from those investments. If capital preservation is key, then they will have to dial back the returns, and those aiming for higher returns must ensure they have the timeline to ride out dips. In short, investors should ignore conventional thinking on income and growth allocations and instead allocate according to investment objectives.
The power of the equity portfolio
With the Dow Jones Industrial Average at 14,515, beyond its 2007 peak, and the FTSE 100 at 6,515 and fast approaching its 2007 high, investors are right to be cautious. At these levels, the biggest fear is below-average returns at best, or permanent loss of capital at worst - that's something those approaching retirement can ill afford.
Certainly there are warning signs. The cyclically-adjusted price-earnings ratio (or CAPE, which averages profits over 10 years), devised by Robert Shiller, is a good indicator for long-term value – currently at 23.51 times, it’s above its long-run average of 15.6 times. Another measure, the Q ratio (or Tobin's Q), which compares shares to the replacement cost of net assets, shows the American market as 51 per cent overvalued, according to Smithers & Co, a consultancy.
But equity investment needs to be put in context of the alternatives. Cash returns are almost zero, or negative once adjusted for inflation. And if there are fears over equity valuations, fixed income is looking worse - after a 30-year bull run in government bonds it has now entered bubble territory. The other factor long-term equity investors need to bear in mind is that valuation measures are also useless for telling you when to invest.
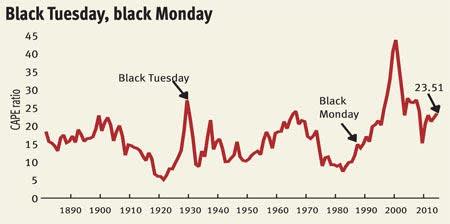
Many investors missed the rally from 2009 entirely because they were waiting for a bargain single-digit Shiller CAPE, and it never happened - the lowest it touched was 13.3 times in March 2009. Investors in July 1995 who thought the market was overvalued when the Shiller CAPE was 23.38 times, would have missed out on a six-year bull run until the bubble burst in September 2000 when the Shiller CAPE touched 42 times.
Investors worrying about the future of equity markets should also consider another piece of advice from Vanguard's Bogle, who also wrote the popular The Little Book of Common Sense Investing. He thinks they must hold stocks in the long term because, risky as the market may be, it is still likely to produce better returns than alternatives. "Wise investors won't try to outsmart the market," he says "They'll buy index funds for the long term, and they'll diversify."
IC VIEW:
Investing has little to do with consistently outsmarting the market (impossible), or timing it perfectly (again, impossible). The greatest investors simply make the least mistakes over an extended time period, and survivorship bias does the rest. When the crisis hits, it isn't that they 'got it right' - they just didn't get it as wrong as everyone else, leaving them with more chips to take advantage of a mispricing and still in the market when it recovers.
Many investors perceive there to be much more risk in the equity markets than there actually is, and largely the risks are self inflicted. Through this article, backed up by academic studies and real world examples, we are giving equity investors the tools to ensure they have mathematics and probabilities on their side - and ultimately peace of mind. Investment rules also give investors greater freedom and time to take advantage of opportunities when they present themselves rather than panicking about the entire portfolio when a short-term crisis inevitably hits.
The ideal portfolio
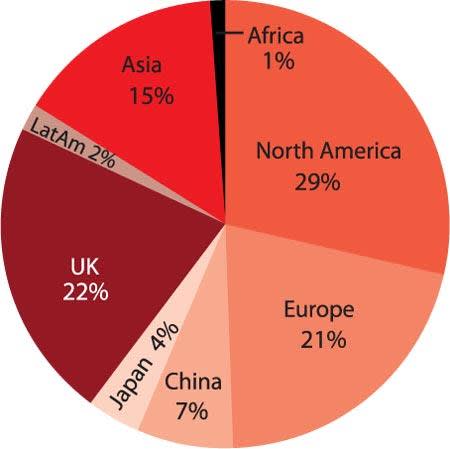
The Investors Chronicle has applied the rules to come up with the following illustrative portfolio. As always, investing is an art not a science and for each company revenue was used as a guide to establish geographic exposure (see pie chart below), while industry weightings were as per FTSE. We also used a mix of shares, investment funds and ETFs to ensure we achieved the right balance.
| Company | Weighting | Ticker | market | Listed (p) | Price value (£m) | Market ratio | PE yield | Dividend |
|---|---|---|---|---|---|---|---|---|
| 1 | Nestlé | 5% | NESN | Switz. | 69 | 221,060 | 20.6 | 2.84 |
| 2 | GlaxoSmithKline | 7% | GSK | UK | 1,508 | 74,009 | 13.4 | 4.91 |
| 3 | HSBC | 7% | HSBA | UK | 726 | 134,105 | 14.7 | 3.55 |
| 4 | Standard Chartered | 6% | STAN | UK | 1,731 | 41,770 | 13 | 3.22 |
| 5 | Visa | 7% | V | US | 158 | 83,680 | 44.2 | 0.84 |
| 6 | British American Tobacco | 5% | BATS | UK | 3,497 | 67,407 | 17.7 | 3.86 |
| 7 | Royal Dutch Shell A | 9% | RDSA | UK | 2,181 | 82,257 | 7.7 | 5.2 |
| 8 | Centrica | 6% | CNA | UK | 354 | 18,368 | 13.1 | 4.63 |
| 9 | Vodafone | 7% | VOD | UK | 189 | 92,282 | 12.5 | 5.16 |
| 10 | N Brown | 4% | BWNG | UK | 426 | 1,206 | 14.6 | 3.1 |
| 11 | Rio Tinto | 7% | RIO | UK | 3,150 | 44,476 | 7.2 | 3.39 |
| 12 | IBM | 7% | U:IBM | US | 213 | 237,624 | 14.8 | 1.59 |
| 13 | Oxford Instruments | 7% | OXIG | UK | 1,719 | 978 | 27.9 | 0.6 |
| 14 | Henderson Smaller Companies Investment Trust | 8% | HSL | UK | 313 | - | - | 2.22 |
| 15 | Db X-Trackers MSCI (LON) USA TRN IDX.ETF U$ | 8% | XMUD | UK | 38 | - | - | 0 |