
The four core picks from last year's James O'Shaughnessy Growth screen have had a strong run, generating a total return of 15.2 per cent compared with 9.6 per cent from the FTSE All-Share. That takes the cumulative total return from the screen, which focuses on a combination of earnings growth, value and momentum, to 112 per cent over th three years I have been running it, compared with 36.6 per cent from the market. Factoring in a 1.25 per cent charge for dealing costs, the cumulative total return stands at 104 per cent.
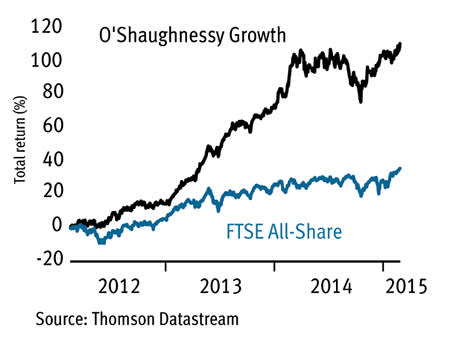
Source: Thomson Datastream
The O'Shaughnessy Growth screen is the sister screen to the O'Shaughnessy Value screen I ran in this column last week. It's designed to generate higher returns than the value screen, but with more risk. As with the value screen, Mr O'Shaughnessy, the author of 1996 investment classic What Works on Wall Street, devised his growth stockpicking criteria from extensively back-testing US markets to see which metrics were best at predicting share price movements. Screens are more commonly attempts to emulate a pre-existing investment philosophy or strategy.
Also in common with the value screen, Mr O'Shaughnessy intended the growth screen to be used to construct a portfolio of 50 shares. So the fact that this year's screen has only managed to get 10 positive results - albeit better than the four results from last year - means the process has some clear limitations in the way I have applied it to the UK market.
That said, concentrating on stocks from the FTSE All-Share that pass all the screen's tests has produced strong results. Due to the limited number of stocks that qualified from all the screen's tests in 2014, I also included 14 stocks in last year's results that had passed a watered down 'growth' test. This experiment was not a success. If the performance of those 14 stocks is taken into account, the overall return from the screen is a lot less impressive (see table). The asterisked stocks in the table are those that passed the full screening criteria.
| Name | TIDM | Total return (11 Feb 2014 - 24 Feb 2015) |
|---|---|---|
| WH Smith* | SMWH | 30.9% |
| Staffline* | STAF | 37.6% |
| Hilton Foods* | HFG | -13.2% |
| Booker* | BOK | 5.4% |
| Kentz | KENZ | 41.2% |
| Headlam | HEAD | -4.1% |
| Dart Group | DTG | 16.5% |
| Porvair | PVAR | 1.4% |
| Walker Greenbank | WGB | 10.5% |
| Lavendon | LVD | -11.4% |
| Synectics | SNX | -70.7% |
| Portmeirion | PMP | 23.9% |
| Galliford Try | GFRD | 32.8% |
| Wynnstay | WYN | -10.8% |
| Carr's Milling | CARM | -20.6% |
| Connect | CNCT | -14.2% |
| Lookers | LOOK | 23.5% |
| Prudential | PRU | 29.8% |
| FTSE All-Share | 9.6% | |
| Average |
While Mr O'Shaughnessy describes this as a growth screen, its criteria also focus on momentum and value. Mr O'Shaughnessy uses price-to-sales (PSR) as his indicator of value as his extensive back-testing of the market indicated that this often-overlooked metric was the king of value indicators.
The full criteria are:
Value criteria: A price-to-sales (PSR) ratio of 1.5 or less. The normal explanation for why investors should pay attention to PSR is that a company with strong sales may have the potential to make good profits from those sales over time even if it is not doing so at present. But the market can be so busy looking at earnings that it misses this future potential. Growth criteria: Mr O'Shaughnessy demands earnings growth in each of the last five years. Momentum criteria: Mr O'Shaughnessy's original screen was based on selecting the 50 stocks with the best one-year momentum. But since first publishing What Works on Wall Street he has said that shorter periods can also work well. I focus on three-month momentum as there are academic studies that suggest this is optimal for a pure momentum strategy. All stocks have to demonstrate superior three-month momentum to the FTSE All-Share. |
The 10 shares passing the growth screen are ordered from highest to lowest three-month momentum below. I've provided short write-ups of the investment case for the five shares showing the most momentum, while the rest of the results are included in the table that follows.
10 STOCKS FOR GROWTH, VALUE AND MOMENTUM


