Source: Schroders/Thomson Datastream/MSCI
Schroders was kind enough to let us loose on their underlying data to produce the scatter diagram below, which shows the trade-off between yield and cover on a stock-by-stock basis (a few extreme bits of data have been chopped to make the chart intelligible). Clearly, if investors want a decent yield these days it's not likely to be coupled with a great deal of dividend cover.

Source: Schroder/Thomson Datastream
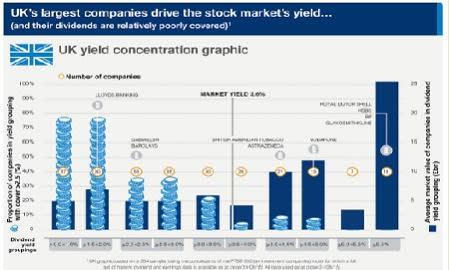
The median cover for the highest-yielding half (2.6 per cent and over) of the UK's leading shares currently stands at just 1.9 times. Meanwhile the highest-yielding quarter (3.7 per cent and over) of leading shares have a flimsy median cover of 1.6 times. At the other end of the spectrum, the lowest-yielding quarter (2 per cent and below) of shares offer a more reassuring median cover of three times.
A high yield with low cover can often be a dangerous combination. As Mark Slater, manager of the top-performing MFM Slater Income fund, says: "If a company is busting a gut to pay a very high yield and that's all it can do, then it may very well be a value trap."
One key question that comes out of all this is: which stocks do the best job of combining yield and cover? A ranking methodology outlined by hedge fund manager Joel Greenblatt in his investment classic "The Little Book That Beats The Market" offers a great way to try to answer this question. The Greenblatt method - he used it for his earnings-focused magic formula - is to rank shares by their yield, then rank them separately for their dividend cover, and then add the rankings together to produce a combined ranking to identify the most attractive shares. On this analysis, the most attractive leading UK shares (and there are some rogues in this particular gallery) are:
| Company | Price | Dividend yield | Dividend cover |
|---|---|---|---|
| 3I GROUP | 492p | 4.1% | 3.65 |
| KENNEDY WILSON EU.RLST. | 1,184p | 3.4% | 3.70 |
| CENTAMIN | 60p | 3.2% | 4.20 |
| PETROFAC | 892p | 4.7% | 2.56 |
| RIO TINTO | 2,388p | 6.2% | 2.34 |
| BANK OF GEORGIA HDG. | 1,743p | 3.4% | 3.20 |
| HUNTING | 518p | 3.3% | 3.23 |
| MAN GROUP | 161p | 4.6% | 2.40 |
| WOOD GROUP (JOHN) | 639p | 2.9% | 3.56 |
| INTERNATIONAL PSNL.FIN. | 398p | 3.1% | 3.24 |
| GKN | 292p | 2.9% | 3.45 |
| WEIR GROUP | 1,404p | 3.1% | 3.20 |
| INTERSERVE | 585p | 4.0% | 2.56 |
| NORTHGATE | 500p | 2.9% | 3.45 |
| ANGLO AMERICAN | 741p | 7.4% | 2.02 |
| AVIVA | 484p | 3.7% | 2.56 |
| POLYMETAL INTERNATIONAL | 483p | 2.8% | 3.38 |
| DEBENHAMS | 76p | 4.5% | 2.18 |
| ROYAL MAIL | 464p | 5.0% | 2.04 |
| ROYAL DUTCH SHELL B | 1,707p | 7.1% | 1.90 |
| SAINSBURY (J) | 243p | 5.4% | 1.95 |
| WILLIAM HILL | 360p | 3.4% | 2.49 |
| CREST NICHOLSON HOLDINGS | 553p | 3.0% | 2.71 |
| HOME RETAIL GROUP | 152p | 2.5% | 3.26 |
| NOSTRUM OIL & GAS | 490p | 3.7% | 2.26 |
| AGGREKO | 1,067p | 2.5% | 3.10 |
| OLD MUTUAL | 200p | 4.5% | 2.06 |
| KELLER | 983p | 2.6% | 2.94 |
| PHOENIX GROUP HDG. | 844p | 6.3% | 1.81 |
| AMEC FOSTER WHEELER | 807p | 5.4% | 1.84 |
Source: Schroder/Thomson Datastream