

The All-Share index is now below its 10-month average. This matters because as Mebane Faber of Cambria Investment Management pointed out in an influential paper back in 2007 a simple policy of buying an equity index when it is above its 10-month average and selling when it is below it has succeeded for years. He's estimated that since 1901 this rule has given higher returns on the S&P 500 than a simple buy and hold strategy, with significantly less volatility.
But would such a rule have worked in the UK in recent years? The answer is yes: partly.
If you'd followed the rule "buy when the All-Share index is above its 10-month average and switch into cash when it is below it" at the end of each month since 1985, £100 then would have grown to £1,453 by now, assuming no dealing costs. (This isn't wholly unreasonable: many unit-linked pensions allow cost-free switching). This is only slightly less than the £1,469 that a buy-and-hold strategy would have delivered. However, the 10-month average rule's returns have been much less volatile: the annualised standard deviation of monthly returns has been 11.5 per cent, compared with 15.6 per cent for the buy-and-hold strategy. This implies a much better Sharpe ratio: more returns per unit of volatility.
You might object that random switching between equities and cash might deliver a similar pattern simply because cash is safer than equities. This, however, ignores two things.
One is that the 10-month average rule would have protected us from the worst market falls. Buy-and-hold lost 34.4 per cent in the 12 months to October 2008. But the 10-month average rule got us out of equities in late 2007 and so actually made a small profit then.
Secondly, the fact that the 10-month average rule has matched buy-and-hold since 1985 disguises the fact that it has done much better recently. Since December 1999 it has returned 7.5 per cent per year compared with just 3.5 per cent per year for buy-and-hold. All of the 10-month average rule's under-performance came in the 80s and 90s.
Three investment rules
To see why this should be, think about possible patterns of equity returns. One pattern is for the market to rise gently most of the time, interrupted by occasional crashes. In this pattern, the 10-month average rule does terribly because it is in equities before the crashes and misses some of the subsequent recoveries. The market followed this pattern for much of the 80s and 90s so the rule did badly. The opposite sort of rule - "buy on dips" - would have done much better.
But there's another possible pattern. If there is momentum in aggregate markets then falls might lead to further falls. The10-month average rule protects us from these. As Mr Faber has said, it "can avoid lengthy and protracted bear markets". Not only did the rule get us out of equities before the 2008 financial crisis, it also got us out in late 2000, thus protecting us from much of the slump in tech stocks.
Of course, in real time we cannot tell whether a fall in share prices below the 10-month average is a dip or the start of a long bear market. What we do know, though, is that the latter can be very nasty indeed. And the 10-month average rule protects us from this possibility. It would save us some of the pain equity investors would suffer if secular stagnation continues or intensifies.
| Comparing three investment rules | |||
|---|---|---|---|
| Buy & hold | 10-month average | May Day-Halloween | |
| Return | 9.45 | 9.41 | 12.29 |
| Standard deviation | 15.6 | 11.5 | 9.8 |
| Sharpe ratio | 0.60 | 0.82 | 1.26 |
| Worst month | -26.5 | -26.5 | -9.9 |
| Worst 12 months | -34.4 | -22.6 | -11.3 |
| Based on returns since December 1985 | |||
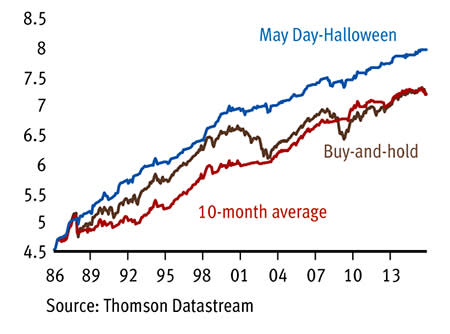
There is, however, another rule that has done even better than the 10-month average rule: sell on May Day and buy on Halloween. Since 1985 it has given us higher returns, lower volatility and lower worst-case losses than either buy-and-hold or the 10-month average rule.
This rule, of course, tells us that the time is coming when we should shift into equities even though the 10-month average rule would tell us to stay out then, unless the market rises a lot in October.
There is, though, a problem here. The 10-month average rule has beaten the May Day-Halloween rule since 2000, giving both higher returns and slightly less volatility. If you think the 2000-15 pattern of returns is typical of the future pattern - that is, some long bear markets - you should therefore stay out of equities. If, however, you think the post-1985 pattern is more typical - with some long bear markets but also some dips - you should prefer to buy on Halloween. Personally, I shall do the latter, albeit with some trepidation.


