

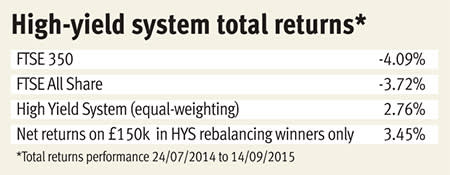
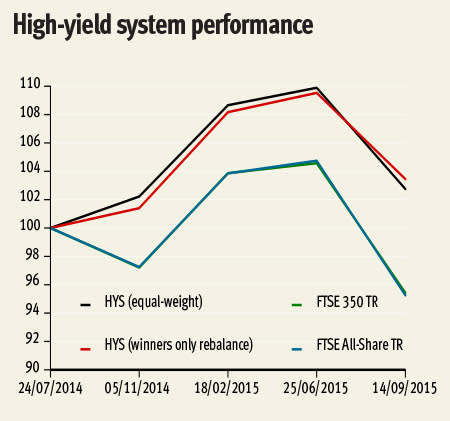
Re-running the High-yield system on 14 September it was pleasing to see that total returns since July 2014 are positive despite the recent market turbulence. The selection methodology is detailed in the box below and assuming equal-weighted rebalancing and reinvestment of dividends, the system returned 2.76 per cent compared with losses of 4.09 per cent for the FTSE 350 or 3.72 per cent for the FTSE All-Share (also including dividends reinvested) over the same timeframe.
There is, however, more thought required to make the system practicable, particularly with regard to the many additional costs faced by investors. The 2.76 per cent total returns does not allow for the charges incurred from four sets of rebalancing trades, stamp duty or income tax. Looking back at the past changes to the portfolio, a different rebalancing approach could have kept charges to a minimum and improved overall performance. Retrospectively applying rules designed to reduce turnover demonstrates how, with the same selections, the portfolio could have made 3.45 per cent net of all taxes and charges.
Taking a hypothetical starting pot of £150,000 (rising to £150,937.02 to account for the stamp duty reserve tax (SDRT) and dealing costs when buying the first group of shares), investment was split evenly between 15 holdings. Rebalancing to an equal-weighting on review dates, as initially assumed by the system, would prove very expensive so this is the first aspect of the methodology to revise. Two simple rules can drastically reduce turnover: 1) only rebalancing holdings with positive momentum since the last review; 2) only making trades when at least a 5 per cent change in the holding is required to match the amount implied by a rebalancing (of 'winners') calculation.
For example, between 25 June and 14 September, three companies - Imperial Tobacco (IMT), Londonmetric Property (LMP) and Galliford Try (GFRD) - had seen their share price increase. Adding the value of these holdings to cash from the disposal of Old Mutual (OML), dividends received in the period and other spare cash, gives a rebalancing pot. From this we need to deduct SDRT from the June rebalance*, before dividing by four (the three companies plus the new holding to replace OML). This gives the ideal size of the holding in these 'winners' from the last period but there is little point in paying good money to change a position by just a few per cent. As only LMP required a change of more than 5 per cent, this is the only trade that is worthwhile. Subtracting the value of IMT and GFRD from the rebalancing pot, the remainder is split between LMP and the new shares in Kier Group (KIE). Thus turnover is limited to the purchase of 802 shares in KIE and the sale of 518 shares in LMP (note: dealing charges are subtracted from the amount available for buys and from spare cash leftover from portfolio changes for sells).
The treatment of dividends is also different to the constant reinvestment assumed by the original High-yield system. Many brokers offer a cheaper dividend reinvestment service but this still racks up charges and in the case of companies such as Anglo American (AAL) and BHP Billiton (BLT), where the share prices have been in a tailspin for months due to blood-letting in commodities markets, it is better to reinvest dividends elsewhere in the portfolio. For these reasons, cash from dividends is accumulated and placed into the rebalancing total on the review dates. Overall, taking the approach outlined to manage turnover and dividend reinvestment, the portfolio would, on 14 September, be worth £156,142 after tax and charges; not bad in the wake of the heightened volatility from August.
Does the pattern for mining holdings provide a warning for the future?
So, overall, the portfolio appears to be in a healthy state, delivering positive net total returns and comfortably outperforming the FTSE 350 (the most appropriate benchmark) and the FTSE All-Share (the universe from which the shares are selected). By not equal-weighting all the shares at each review, the system would have avoided losing money reinvesting in companies that face serious headwinds. Of these, the aforementioned mining stocks stand out but between them now represent only roughly 6 per cent of the portfolio. They remain good dividend payers, however, and yields above the portfolio average have prevented them from being sold.
Not topping up the holdings in AAL and BLT has meant that the portfolio is proportionately far less exposed to weak commodities markets. Although keeping hold of stocks that are doing badly does beg the question: how would the system work if a number of the other holdings were to also face a period of cyclical downturn? This point is worth considering as, although the portfolio invests across different sectors, the strong performance of several companies is linked to rising UK property values and infrastructure spending. In a different stage of the economic cycle, when these investments aren't doing so well, will the system naturally rebalance the portfolio or will falling prices result in higher yields, that prevent the sale of poor performers?
On its own, the High-yield system is not diversified enough, so should not form the sole basis of any portfolio. Thus far, however, it is proving an effective tool for a UK equities selection that might work well as part of a broader asset allocation strategy. In addition to the tables published here, a
, applying the re-outlined dividend management and rebalancing methodology to the system's past trades, is available on Investors Chronicle website.On a final note, the tables for June-September 2015, highlight that 551 shares in LMP were bought on 25 June only for 518 to be sold again on 14 September. This seems absurd, so to avoid more unnecessary trades, and fit better with the frequency of dividend payments, going forward reviews will take place on a six-monthly, rather than a quarterly, basis.
| NAME | Share price (£) 14/09/2015 | Market cap (£m) | 12-month share price change (%) | Share price change (%) 25/06/2015 to 14/09/2015 | Dividend yield (%) 25/06/2015 to 14/09/2015 | Total return (%) 25/06/2015 to 14/09/2015 | Dividend cover | Sector |
|---|---|---|---|---|---|---|---|---|
| IMPERIAL TOBACCO | 3254 | 31143.71 | 18.2 | 1.21 | 4.06 | 1.9 | 1.6 | Tobacco |
| OLD MUTUAL | 189.5 | 9339.19 | -2.32 | -9.55 | 4.7 | -9.55 | 2.2 | Life Insurance |
| MAN GROUP | 164 | 2786.5 | 33.66 | -2.67 | 4.52 | -0.61 | 2.8 | Financial Services(4) |
| LEGAL & GENERAL | 251.7 | 14966.2 | 5.71 | -2.56 | 4.69 | -1.31 | 1.5 | Life Insurance |
| CARILLION | 317.4 | 1365.63 | -2.55 | -11.22 | 5.62 | -9.69 | 2 | Support Services |
| HICL INFRASTRUCTURE | 152.3 | 2023.29 | 5.76 | -0.98 | 4.83 | 0.24 | 2.5 | Eq. Investment Inst |
| ANGLO AMERICAN | 716.9 | 10049.8 | -51.66 | -27.94 | 7.99 | -26.02 | 1.7 | Mining |
| GALLIFORD TRY | 1800 | 1481.23 | 45.51 | 0.95 | 3.33 | 0.95 | 1.7 | Hhold Gds & Home Con. |
| CLOSE BROTHERS GROUP | 1508 | 2253.98 | 8.02 | -7.09 | 3.35 | -7.09 | 2.21* | Financial Services(4) |
| GO-AHEAD GROUP | 2392 | 1028.66 | 1.4 | -11.6 | 3.76 | -11.6 | 1.7 | Travel & Leisure |
| AMEC FOSTER WHEELER | 749.5 | 2922.84 | -31.24 | -11.88 | 5.78 | -11.88 | 1.7 | Oil Equip. & Services |
| LONDONMETRIC PROPERTY | 167.5 | 1051.97 | 18.71 | 3.59 | 4.33 | 3.59 | 3.5 | REITs |
| SEGRO | 411.3 | 3074.48 | 13.62 | -1.72 | 3.2 | -0.62 | 8.1 | REITs |
| BHP BILLITON | 1068.5 | 22567.46 | -37.99 | -20.02 | 7.77 | -16.99 | 0.52* | Mining |
| ROYAL MAIL | 465.7 | 4657 | 9.99 | -11.21 | 5.01 | -8.7 | 1.8 | Industrial Transport |
| Portfolio Average | 4.86 | |||||||
| New Buy 14/09/2015 | ||||||||
| KIER GROUP | 1513 | 1446.3 | 12.5 | 5.22 | 4.86 | 5.22 | 1.7 | Construct. & Material |
Source: Thomson Datastream, except * items from Bloomberg **Sold 14/09/2015
High-yield system
■ Positive 12-month price momentum.
■ Market capitalisation in the top 40 per cent of the universe.
■ Dividend yield not in the top 10 per cent of the universe (this is a quality measure).
■ Dividend cover above 1.5.
■ Remaining shares ranked on dividend yield.
■ Companies sold if they combine negative 12-month price momentum with a dividend yield below the portfolio average; or, if the dividend is passed.
■ Diversification rules: no new addition can increase the number of companies in one sector above two; and there can be no more than five companies in the broad financial sector (banks, financial services, life insurers).
New rebalancing rules
■ Portfolio rebalanced every six months.
■ 'Winners only' rebalancing of shares with positive price momentum since the last review.
■ Only rebalance shares where a minimum 5 per cent holding change is required.
A note on tax
In the hypothetical portfolio, the higher rate of taxation for dividends (32.5 per cent) is applied. This will change when new dividend tax rules come into play in April 2016. This portfolio could be more tax-efficient if placed in a Sipp wrapper. As mentioned, however, the high-yield system is not diversified enough to be solely relied on to achieve a goal as serious as saving for retirement. Therefore, the assumption is made that the portfolio is ‘fun money’ we can afford to play with, managed in an ordinary sharedealing account. The disposal of shares in the period has not produced enough of a net capital gain to be subject to capital gains tax (CGT).
*For the sake of simplicity, it is assumed that SDRT is paid from some other cash source at the point of share purchase. It is allowed for later on by deducting it from the rebalancing pot at the next review date.


