

Being totally honest, we’ve stolen our pun on the name of modfather Paul Weller’s second band from the team at Société Générale Cross Asset Research, which has been publishing research into investment styles under the ‘Style Counsel’ heading since the early 1990s. When your day job is crunching financial data the desire for levity is understandable, but, as $429bn (£344.52bn) of assets invested globally in smart-beta exchange traded funds (ETFs) demonstrates, identifying the granular style factors that systematically drive equity returns is a serious business.
The theory underpinning style or ‘factor’ investing, as it is also now commonly known, is that certain characteristics explain the performance of stocks. As Andrew Lapthorne, head of the SG research team that produces the Style Counsel reports, puts it: “You are trying deliberately to orient your portfolio towards the key drivers of equity market performance over time.” In a low-return world, this concept is attractive to investors hoping to squeeze more from equities, and ETF providers now offer products with concentrated exposure to stocks with strong income, value, momentum, low volatility and quality characteristics.
How should investors think about factor investing? For Mr Lapthorne, you start with the question “how does buying a stock make me money?” He explains as follows: “Now most people would buy a stock because they hope the share price goes up. But why does it go up? Is it a valuation change, having a high compounding dividend yield or because it delivers better [profit] growth. Essentially these return drivers are, in effect, styles.”
Style factors
Going into further granularity, there are particular financial ratios and other data such as patterns of share price movements that can be taken as ‘factors’ in the overall performance. For example, a low price-to-book (PB) ratio is a sign of a value stock, or a high return on equity (ROE) signifies quality. As the table below shows, there are several factors that could be described as indicating growth, value, quality or momentum – and factor investing strategies may screen for a number of these.
| Systematic factors | Historical risk premium | Historical factors to target |
|---|---|---|
| Value | Captures excess returns to stocks that have low prices relative to their fundamental value | Price to book, earnings to price book value, sales, earnings, cash earnings, net profit, dividends, cash flow |
| Low size (small-cap) | Captures excess returns of smaller firms (by market cap) relative to larger counterparts | Market capitalisation (full or free float) |
| Momentum | Reflects excess returns to stocks with stronger past performance | Relative returns (3-month, 6-month, 12-month, sometimes with last 1 month excluded), historical alpha |
| Minimum volatility | Captures excess returns to stocks with lower than average volatility, beta and/or idiosyncratic risk | Standard deviations (1-yr, 2-yrs, 3-yrs), downside standard deviation, standard deviation of idiosyncratic returns, Beta |
| Dividend yield | Captures excess returns to stocks that have higher-than-average dividend yields | Dividend yield |
| Quality | Captures excess returns to stocks that are characterised by low debt, stable earnings growth, and other 'quality' metrics | Return on equity, earnings stability, dividend growth stability, strength of balance sheet, financial leverage, accounting policies, strength of management, accruals, cash flows |
Why tilt your style?
The efficient market hypothesis (EMH) posits that ultimately all information will be priced in to the stock market and therefore buyers and sellers will come to a fair price. The upshot is that it ought to be impossible to beat the market on a consistent basis. Mr Lapthorne states that he has never believed in EMH and that there is plenty of evidence suggesting markets do not operate efficiently, especially in real time.
The explanation for the momentum phenomenon offered by US-based academics Jegadeesh and Titman (1993) is that investors underreact to good news and therefore further gains are often to be had as market participants catch on. There are also behavioural finance explanations for value (investors overlook companies on the basis of some past weakness that may no longer hold) and minimum volatility (investors are drawn to glamour or lottery stocks, leaving solid but less fashionable companies relatively underpriced). The outperformance over time of stocks that can be classified according to these factors places a major question mark against the EMH and provides investors with possibilities to maximise returns.
Choosing to tilt a portfolio towards a particular style/factor is a tactical decision to try to beat the market-capitalisation-weighted benchmark. One simple way to target returns is by screening for stocks according to factors and then equal-weighting the results in a portfolio. This presents problems for index providers, however, who need to consider the liquidity of stocks and trading costs when rebalancing the strategies. Some factors (such as value, momentum and, rather obviously, size) are more evident in smaller stocks, which are less liquid and most expensive to trade. Therefore, the preferred method for developing investable factor indices is to assign each stock in the parent index a factor rating and multiply this by the market capitalisation to give a new factor weighting.
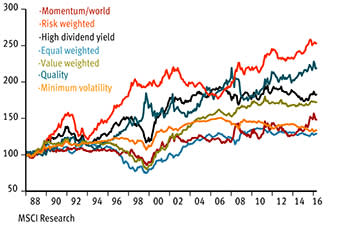
Using a combination of data from its own indices and those of Barra Research (the company it purchased from fallen quant star Barr Rosenberg in 2003), index provider MSCI has back-tested a suite of global factor indices to 1975. Comparing performance to parent index the MSCI World, the indices have all delivered periods of significant outperformance. Different factors will carry increased or reduced reward-to-risk characteristics and it should be remembered that some factors have suffered periods of serious underperformance.
Performance of factors versus MSCI World
Intriguingly, negative correlations have been observed between different styles, which means that, if the same holds true going forward, it could be possible to hedge factors. Value and momentum composite strategies have long been recognised as complementary to one another. However, these are two of the most volatile factors and it could be dangerous for investors should the relationship that offsets negative returns break down. Mr Lapthorne explains that there have also been times after major market declines when the losses from the momentum strategy are so significant as to overload the gains from value.
Tactical style tilts
Given these risks, a policy of binary hedging between value and momentum is not really suitable for retail investors. A more balanced system might be to invest in a market-capitalisation-weighted index – which gives the most representative investment play on the whole available equity universe so should be less volatile – and take satellite positions in value or momentum factor ETFs depending on tactical macro calls.
On the subject of macro calls, one of the conundrums facing investors in this era of low implied returns and high valuations, is whether the quality and income stocks that have been the focus of most equity inflows are now overpriced. If so, is it time to rotate more into value stocks? Mr Lapthorne advocates a balanced approach, as it is extremely difficult to time markets based on macro calls: “Quality [factor] has defensive properties and would do well during a market downturn, but the market has placed a high premium on such protection. So balancing this expense with the cheaper and more cyclically exposed value style, even if you are concerned about lacklustre economic growth, makes sense over the long term.”
Value investing tends to be cyclical and its success depends more on economic growth than policy announcements. Traditionally, value screens have placed great emphasis on the price-to-book value (PB) ratio, which shows whether shares in a company are cheap relative to underlying assets. The reason for a low PB rating could be that a company’s assets aren’t highly valued by the market as they aren’t actively generating revenues. In a more buoyant economy, such a situation may change and the shares could rise on the re-rating. In an era of flat growth and weak productivity in developed economies, there has been less reason to believe that underemployed resources will be put to use and value as a style has struggled as a result.
Many investment managers have chosen to make a lower allocation towards value and instead favour quality and high-dividend stocks, with a few satellite holdings in some sectors with growth prospects. That said, value is a characteristic that is intrinsic to any investment decision and there are many more subtle ways to indicate it than simple a P/B ratio. For example, index provider MSCI also judges how cheap companies are compared to forward price/earnings (PE), which gives an idea of value against expected profitability. Another metric it uses is enterprise value (EV) – which is the sum of debt and equity – compared with operating cash flow (CFO). Arguably, EV/CFO is also a quality measure; you are comparing the cash flows of a company to the claims on them not only of other shareholders but also bondholders, so a favourable score means you’re getting a good company (with a manageable debt position) for a cheap price.
Style-tilted holdings
Looking forward, it is dangerous to rely too heavily on economic indicators to try to beat the market. After all, forecasts can be wrong and circumstances can suddenly change. For example, the UK’s vote to leave the European Union, and sterling’s subsequent slide triggered a re-rating of quality FTSE 100 stocks – especially those expected to reap a transactional benefit from strong US dollar earnings. In the months since the Bank of England’s aggressive policy response, including quantitative easing (QE) and a cut in the base interest rate to just 0.25 per cent, has until the last fortnight given further impetus to quality and income stocks, partly as investors hunt for dividend-payers to plug the income gap left by low bond yields.
Timing style tilts is as difficult as picking individual shares, although the evidence for factors having outperformed over time means it is worth exploring the merits of a balanced passive approach. Unfortunately, there is not much time behind the ETFs that can be used to facilitate such strategies, so we can only really back-test for about the past two years. This is an inadequate time-frame to assess the efficacy of the available factor investing opportunity set, especially as it doesn’t take in a period of severe market distress such as in 2008-09.
With this caveat, it would have been possible to make better risk-adjusted returns than the MSCI World by combining different investing styles, so going forward we are going to track three equity strategies. These are experimental and will need to build up a track record, but it will be interesting to see how they perform in periods when markets rise and fall to help judge if, in future, any of these style strategies would be suitable for the equity portion of a balanced asset allocation.
Style Strategy 1: Benchmark (50 per cent) plus value (25) and momentum (25)
| 2-yr annualised total return (%) | Volatility (%) | |
|---|---|---|
| IWDA - iShares MSCI World | 2.38 | 17.42 |
| IWVL - iShares MSCI World Value | -0.60 | 20.12 |
| IWMO - iShares MSCI World Momentum | 5.50 | 15.36 |
| Combined strategy (50:25:25) | 2.43 | 17.08 |
Despite the high potential rewards, it is prudent not to become overexposed to factor strategies such as momentum or value where volatility can be highest. The market-cap-weighted MSCI index ETF is a good core holding and, if investors wanted to pursue a value and momentum strategy, it would be sensible to keep 50 per cent in the market capitalisation weighting and split 50 per cent between the two factors. Had we done this since October 2014 then the three ETF portfolios would have made annualised total returns of 2.43 per cent versus 2.38 per cent for just the benchmark. The returns are driven mainly by momentum, with value having done badly, demonstrating the negative correlation between the two factors.
Of course, the additional five basis points return over the MSCI World would have been wiped out by the cost of using three ETFs rather than one. So investors would have been better off investing in just the benchmark than this strategy over the past two years.
Style strategy 2: Go defensive plus income and a value kicker (minimum volatility, income, quality and value - 25 per cent each)
| 2-yr annualised total return (%) | Volatility (%) | |
|---|---|---|
| MVOL - iShares MSCI World Minimum Volatility | 8.70 | 12.42 |
| GBDV - SPDR Global Dividend Aristocrats | 12.33 | 16.05 |
| IWQU - iShares MSCI World Quality | 3.85 | 16.43 |
| IWVL - iShares MSCI World Value | -0.60 | 20.12 |
| Combined strategy (25:25:25:25) | 6.17 | 13.90 |
The star-performing factor strategies of the past two years have been based on minimum volatility, quality and income. Equal-weighting a global equity portfolio between these three styles and value would have achieved an annualised return of 6.17 per cent, with lower volatility than the MSCI World ETF. Again the impact of buying four ETFs needs to be considered, but in this case the performance after costs is still significantly better than the benchmark. Of course, avoiding value altogether would have achieved even better returns, but the purpose of these style strategies is to take a balanced long-term approach and be well positioned for periods when different factors outperform.
Style strategy 3: Benchmark (50 per cent) plus the SG Quality Income (25) and Brave Value (25) indices
| 2-yr annualised total return (%) | Volatility (%) | |
|---|---|---|
| IWDA - iShares MSCI World | 2.38 | 17.42 |
| SGQL - Lyxor SG Global Quality Income | 10.55 | 14.81 |
| SGVB - Lyxor SG Global Value Beta Income | 1.66 | 22.83 |
| Combined strategy (50:25:25) | 4.30 | 14.79 |
The third system aims to take advantage of the work done by the SG quant team, alongside a heavy weighting towards the MSCI World index. The SG team has found in its longer-term back-testing that a more intrepid value strategy performs best, but since the Lyxor ETFs that track their indices have been live their cautious value, or quality income, approach has worked best. Combining the two ETFs is a balanced way to take advantage of absolute value and the best value quality income plays.
Half of the allocation in this strategy is towards the market-cap-weighted MSCI World, for two reasons. Firstly, caution is the better part of valour and we need to allow for the possibility that stock selection strategies may come unstuck at some point. Secondly, the Lyxor ETFs are synthetically replicated, which means that the stocks being tracked are not actually owned in the product structure. Instead, there is a collateral fund of securities and the performance of the underlying index is replicated using swap derivatives. This complexity is offputting to many investors and it does add another layer of uncertainty.
Reiterating the point that many ETFs launched in the past couple of years have yet to go through a major market crisis, we don’t know whether derivatives-based products will suffer more or less. So going by the unscientific investing principle of Murphy’s Law, we should assume that where we don’t fully understand the trades that underpin a product structure, there is additional risk we don’t understand, too. To compensate for this risk of the unknown, it is hoped that the SG strategies continue to outperform similar value and quality income indices.


