The neatness of copper’s recent price rally – which we detailed in a chart shortly after the US presidential election – is a useful example of another form of gearing. Rather than derivatives, this leverage concerns equity prices, and shows why higher-cost producers often end up doing a lot better in price rallies.
The reason for this is simple, but sometimes overlooked. If it costs you $10 to mine a tonne of ore, and the price of the ore jumps from $15 to $20, your margin doubles. If it costs me $14 to mine a tonne of ore, a similar increase would send my margin up by 500 per cent. Apply this leverage to companies – whose share prices are often a function of future expected earnings – and the swing can be dramatic.
Returning to copper, we can see the varying effect of this month’s surge in the metal’s price on different cost profiles. The chart below shows this clearly. Central Asia Metals (CAML), which thanks to its unique resource ‘dump’ in Kazakhstan could boast fully absorbed unit costs were just $0.97¢ per pound in the six months to June, actually lagged the rise in the copper price in the last month. If copper prices look set to rise further, chief executive Nick Clarke may be pushed to prioritise re-investment over shareholder returns, which stood at 26 per cent of revenues at the half-year mark.
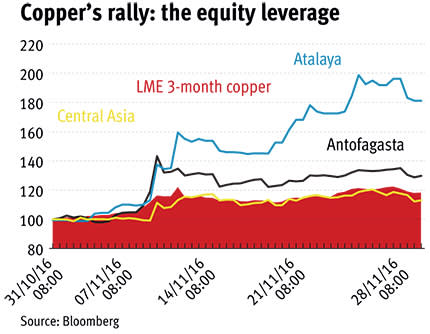
Antofagasta (ANTO) is more leveraged to the copper price appreciation, thanks to its pre-product credit cash costs of $1.58 a pound in the last quarter. This helped the Chilean copper giant rise by nearly a third in the last month, though this in turn paled in comparison to the 80-plus per cent leap at Atalaya Mining (ATYM), which has cash costs of $2 a pound of payable copper, and handily doubled production in its third quarter of this year just in time for the rally.