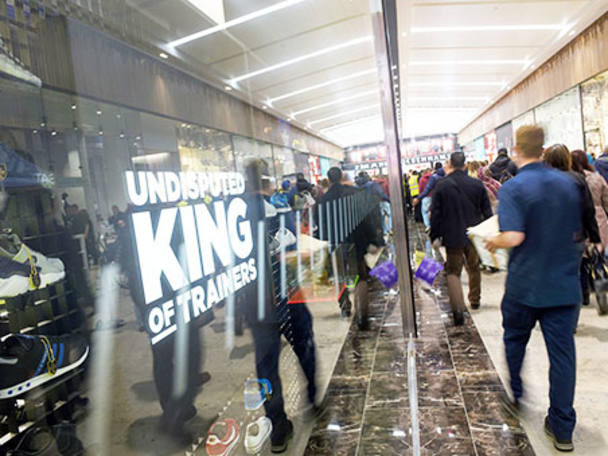
It looks as though 2016 is shaping up to be another exciting year for high-street chain JD Sports Fashion (JD.). The company has hit a sweet spot as several years of store and infrastructure investment starts to bear fruit. This is powering a persistent stream of broker forecast upgrades, which in turn keep pushing the share price higher (see chart below). Trading went extremely well over Christmas, as the company reported combined like-for-like sales growth of 10.6 per cent in the five weeks to 2 January, which prompted the company to tell analysts that expectations for 2016 profits were likely to need adjusting upwards by 10 per cent. And there should be more to come as the company looks to replicate its success in the UK through a European rollout, which is already producing strong returns despite the tricky consumer backdrop.
- Strong Christmas trading
- Earnings upgrades
- European expansion
- Strong domestic growth
- Introduction of new living wage
- Systems overhaul postponed
JD Sports' earnings upgrade
Fashion retailing is a competitive industry to be in, but compared with its closest rival Sports Direct International (SPD), JD Sports is a clear winner. Still, management has seen fit to remind investors that the sales growth rates seen over the past couple of years are "unlikely to continue indefinitely". But growth should nevertheless be impressive given the investments the company has made in areas such as multichannel sales and improved buying and merchandising.
For now, the company's main growth initiative is its European expansion plan. So far, the European business - one-fifth of first-half sales - is said to be going well, although there has been some short-term impact on margins due to the weak euro. By the start of August 2015 the company had 84 operating outlets - a net increase of 27 - across mainland Europe and had subsequently opened two new sites in Belgium. A flagship store was also due to open in Amsterdam as the company expands the brand across the Netherlands. The mixed consumer backdrop in Europe may be a concern for some, but management says sales are in line with expectations and largely match the like-for-like performance recorded in the UK.
Back on home soil, JD's bosses haven't forgotten about the company's struggling outdoor business, which is starting to recover. The Blacks, Millets and Ultimate Outdoors brands are now under a common, single leadership and there's better engagement from managers over merchandising. The division reported contracted losses of £4.5m during the six months ended 1 August 2015 (from losses of £5.6m in 2014), and a significantly improved performance is expected during the 2016-17 financial year, too.
Finally, one can't forget how cash generative JD Sports is. At the end of the first half the company had net cash of £100m, which was up from £11m a year earlier. Most of the money has been earmarked to fund future expansion and working capital requirements. We're encouraged by this as the best use of a company's surplus funds is always to invest in profitable growth, if genuinely high-return opportunities exist. However, it's also a good sign that JD lifted the half-year dividend by 4 per cent, although its shares are no yield play.
Interestingly, the company recently announced it would not persist with an overhaul of its IT systems. While this will lead to a write-off in the current year of around £12m, the company believes developing its existing systems will provide a cheaper and lower-risk solution.
| JD SPORTS FASHION (JD.) | ||||
|---|---|---|---|---|
| ORD PRICE: | 1,037p | MARKET VALUE: | £2bn | |
| TOUCH: | 1,036-1,037p | 12-MONTH HIGH: | 1,165p | LOW: 446p |
| FORWARD DIVIDEND YIELD: | 0.8% | FORWARD PE RATIO: | 16 | |
| NET ASSET VALUE: | 162p* | NET CASH: | £100m | |
| Year to 31 Jan | Turnover (£bn) | Pre-tax profit (£m)** | Earnings per share (p)** | Dividend per share (p) |
|---|---|---|---|---|
| 2013 | 1.30 | 60.5 | 88.5 | 26.3 |
| 2014 | 1.22 | 81.8 | 31.7 | 6.8 |
| 2015 | 1.52 | 100 | 40.1 | 7.1 |
| 2016** | 1.81 | 149 | 58.1 | 7.4 |
| 2017** | 2.00 | 160 | 63.5 | 7.8 |
| % change | +10 | +8 | +9 | +5 |
Normal market size: 750 Matched bargain trading Beta: 0.38 *Includes intangible assets of £101m, or 52p a share **Investec forecasts, adjusted PTP and EPS figures | ||||


