

The past 12 months should have been a time for deep value strategies to shine, so why did my screen inspired by legendary contrarian investor David Dreman put in such a poor performance? After all, it was about this time last year that a near-decade of underperformance by a generic 'value' investment style came to an end. The influence of value's revival has had a big impact on returns over the past year and it is a phenomenon that is woven into the investment narrative that's been popularly dubbed the 'reflation' or 'Trumpflation' trade.
The key factor behind this much-vaunted shift in value's fortunes, though, is the simple fact that banking stocks have finally started to show a bit of promise at the same time as resources companies have experienced a substantial recovery from their early-2016 nadir. These sectors are two key components of most key 'value' indices (see chart below).
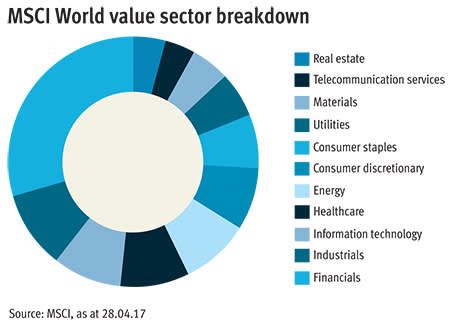
So any value strategy that ignored these big sector themes stood a high chance of looking very ordinary, or worse. And the bad news from the perspective of last year's Dreman screen is that it missed picking any big winners from these parts of the market. Indeed, the two financials it did select failed to keep up with the performance of the broader market and there were no resources stocks among its nine share picks. What's more, much of the value the screen alighted on in 2016 proved to be more 'entrenched' than one would have hoped. Whether or not any of last year's losers will ultimately be classed as 'value traps' remains to be seen, but they definitely failed to shine in the one-year time period over which I assess screen results. Brexit proved a particular blow to the property and housebuilding stocks selected by the screen last year, although there has been a decent recovery since post-referendum lows. Meanwhile, the travails of the retail sector have meant other stocks that looked cheap on the surface a year ago look 'cheaper' still now.
2016 performance
| Name | TIDM | Total return (24 May 2016 - 16 May 2017) |
|---|---|---|
| Legal & General | LGEN | 15% |
| Admiral | ADM | 9.4% |
| McKay Securities | MKAY | 4.5% |
| Kennedy Wilson | KWE | 1.0% |
| Galliford Try | GFRD | -1.8% |
| Trinity Mirror | TNI | -2.3% |
| Bovis | BVS | -5.1% |
| Go-Ahead | GOG | -25% |
| Dunelm | DNLM | -34% |
| FTSE All-Share | - | 24% |
| Dreman | - | -4.2% |
Source: Thomson Datastream
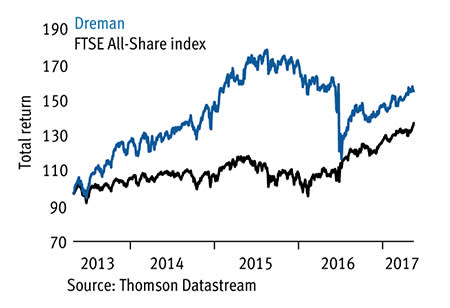
The unfortunate omission of the racier type of value stocks (banks and resources companies) from last year's screen selection has dented the longer-term performance. Still, over the four years I've monitored my Dreman screen it has produced a 57.5 per cent total return, compared with 39.5 per cent from the index. If I factor in an annual 1.5 per cent charge to account for the notional cost of switching from one set of screen results to the next on the date of publication each year, the total return drops to 48.2 per cent.
This cumulative performance figure ignores one previous year when I ran the screen broken up over several weeks, focusing on a separate valuation metric each time. The different time periods mean these results can't easily be built into the cumulative figures. It's worth noting, though, that this excluded year produced poor results mainly due to its focus on the then ailing resources sector. This is potentially interesting because it could be seen as an indication that the screening criteria has a habit of catching apparent 'value' when fundamentals are still deteriorating, as well as when a bad situation has got to the stage that it is unlikely to get much worse and real value exists. As ever, for most people screens are likely to prove most useful as a starting point for further investigation rather than an end in themselves. Indeed, the fact the screen looks for profit improvements and improving forecasts, and that falling valuations often precede any changes in such fundamentals, creates the potential to highlight 'value' situations too early.
Dreman versus FTSE All-Share
The need for a company to be profitable and to show rising profits - can exclude really deep value situations where companies have become lossmaking and brokers have given up all hope in their forecasting - as was the case with many resources stocks a year ago. Nevertheless, there are sound principles behind the screen. The stocks must be among the cheapest quarter of FTSE All-Share constituents based on one or more of: dividend yield (DY); price-earnings (PE); forward next-12-month price-earnings (forward NTM PE); price-to-cash-flow (PCF); or price-to-book-value (PBV). The screen's other criteria (they differ slightly based on which valuation measure a share qualifies on) are:
■ Year-on-year EPS growth in the most recent half-year. ■ Forecast EPS growth for each of the next two financial years. ■ A current ratio of more than 1. ■ Above-average dividend yield (excluding cheap P/BV stocks). ■ Dividend cover of 1.5 times or more, or greater than the five-year average (excluding cheap P/BV stocks). ■ Above-average five-year dividend compound annual growth (excluding cheap P/BV stocks). ■ Gearing of less than 75 per cent or net debt/cash profit of less than 2.5 times. ■ Market capitalisation of £200m or more. |
Six stocks passed the screen this year and no low price-to-book-value shares qualified. The stocks are in the table below and I've taken a closer look at three of them based on three different criteria: dividends, cash flow and earnings.
| Name | TIDM | Mkt cap | Price | Fwd NTM PE | DY* | PEG | P/BV | P/CF | Fwd EPS grth FY+1 | Fwd EPS grth FY+2 | 3-mth mom | Net cash/ debt (-) | Cheap |
|---|---|---|---|---|---|---|---|---|---|---|---|---|---|
| Bellway | BWY | £3.6bn | 2,924p | 9 | 3.7% | 1.2 | 1.8 | 99 | 9.5% | 5.1% | 12% | -£175m | PE |
| Galliford Try | GFRD | £1.1bn | 1,279p | 8 | 6.4% | 0.7 | 1.8 | 19 | 22% | 3.5% | -17% | -£117m | PE, DY |
| Jupiter Fund Mgmt | JUP | £2.2bn | 489p | 15 | 5.6% | 1.9 | 3.6 | 15 | 13% | 3.5% | 14% | £337m | DY |
| Polymetal Int'l | POLY | £4.5bn | 1,057p | 14 | 3.1% | 0.9 | 5.7 | 8.6 | 11% | 19% | 8.6% | -$1.3bn | PCF |
| Taylor Wimpey | TW. | £6.4bn | 197p | 10 | 6.1% | 1.9 | 2.2 | 12 | 6.0% | 5.5% | 12% | £365m | DY, PE |
| Tyman | TYMN | £613m | 346p | 12 | 3.0% | 3.4 | 1.6 | 9.1 | 12% | 4.8% | 22% | -£176m | PCF |
*Includes special dividends
Source: S&P Capital IQ
HIGH DIVIDEND YIELD
Fund manager Jupiter (JUP) qualifies as a high-yielding Dreman stock thanks to its special dividend payouts. As suggested by the name, a special dividend is a less reliable source of income than a company's basic dividend. However, some companies make special payments as a matter of habit for long stretches and Jupiter has been a case in point over recent years. It has a policy of paying out half of its earnings as dividends, along with any surplus cash as a special bonus payment. Broker Numis expects strong trading and a strong balance sheet to mean a total payout (basic plus special dividend) of 30.4p this year and 32.6p next year. That's equivalent to a dividend yield of 6.2 per cent, rising to 6.7 per cent in 2018.
Jupiter is benefiting at the moment from its push to diversify away from the UK and equity funds. Indeed, while these two areas still represent about four-fifths-and-a-half of assets under management, respectively, impressive growth has been coming from elsewhere. In particular, funds investing in bonds, alternative assets and emerging market strategies have been proving a big draw and helped the group report record quarterly inflows in the first three months of 2017. The company's equity investment skills are still a major attraction, too, with Jupiter recently winning a £300m segregated mandate for its highly respected value manager, Ben Whitmore, from Alliance Trust.
The company also has exciting long-term prospects based on changes in the pensions market that are encouraging individuals to become more involved with the management of their savings through defined-contribution schemes. However, the fact that Jupiter has a retail investor rather than institutional focus means it is generally regarded as managing more flighty assets and therefore is seen as having a somewhat lower-quality business than more institutionally focused peers (last IC View: Buy, 475p, 4 May 2017).
LOW PRICE TO CASH FLOW
Importantly for a company attracting attention from the Dreman screen for its lowly priced cash flow, Tyman (TYMN) has a decent record for cash generation before the 12 months its low price-to-cash-flow ratio is based on. What's more, it looks as though cash generation could improve further in coming years as the company's investment commitments get less onerous.
The international doors and windows component company commands a lowly rating based on earnings for a business that has been achieving such strong growth. This apparent 'value' in no small part reflects the fact that the group operates in a highly competitive and cyclical market. However, Tyman has a number of things going for it based on both the actions it's taking to boost profitability and improving trading conditions in the US - its key end market, where it generates almost 60 per cent of sales.
A key element of Tyman's plan to boost profitability is a major overhaul of its American manufacturing facilities through which it aims to increase operating margins to 20 per cent by 2020. The company has already completed the riskiest stage of the project, where there was most scope for spending to run away. Capital expenditure is now expected to fall, which should enhance the cash attractions that this screen has picked up on. The company also expects to boost margins by reducing costs at two businesses it acquired last year and it is planning to push up prices in the UK (its second-largest market at 18 per cent of sales) to offset currency related cost increases.
Further margin improvement, further trading improvement in the US and further acquisitive growth represent an attractive combination of positive factors and could be the foundations of a re-rating should they make the market increasingly perceive cyclicality and competition as background issues (last IC View: Buy, 304p, 16 Mar 2017).
LOW PRICE TO EARNINGS
Housebuilders are a major feature of the Dreman screen this year. However, they are not flashing up as cheap based on the classic valuation metric used to assess the sector: price-to-book-value (P/BV). Indeed, from a historic perspective, housebuilders look expensive based on P/BV, albeit not as expensive as they looked on this measure a year ago. It's housebuilders' price/earnings (PE) ratios that get the screen's attention. The low PE can, for a large part, be put down to the cyclical nature of the sector, which is exacerbated by the huge balance sheet risks associated with housebuilding (lots of land and partly-built homes that can drop steeply in value).
That said, the housebuilders have been enjoying an extended strong run that has encouraged investors increasingly willing to look at the question of valuation in different ways. Bellway (BWY) is a good example of the favourable trends at work based on a supply and demand imbalance and little competition from smaller builders that are considered to be more likely to bid up land prices and cause pockets of oversupply.
Bellway is one of the cheaper stocks in the sector based on P/BV, although its relatively low dividend yield gives some cause for this. Trading is strong, with the company reporting a 9 per cent rise in first-half pre-tax profit in March, as well as an 18 per cent increase in its order book to £1.4bn. The company has also recently nudged up its guidance on volumes growth this year to "at least" 5 per cent and reaffirmed expectations of a bumper 22 per cent margin. Encouragingly, land bank purchases have also picked up again following a brief hiatus as uncertainty about the outlook increased following the Brexit vote (last IC View: Buy, 2,895p, 21 Mar 2017).


