While Algy Hall spends the summer on paternity leave, I will be tending to another of his legacies: the stock screens he has cultivated over the past five years, located in what can only be described as a Knossian labyrinth of spreadsheets and computer folders. This week sees the return of his High-Quality Small-Caps screen, which managed to outperform its benchmark junior indices for the third time in the four years it has been running (see table).
| Name | TIDM | Total return (11/08/15 - 21/07/15) |
|---|---|---|
| GVC | GVC | 50.6 |
| Utilitywise | UTW | -34.3 |
| Brainjuicer | BJU | -1.7 |
| Sepura | SEPU | -64.6 |
| Maintel | MAI | 40.7 |
| Treatt | TET | 10.6 |
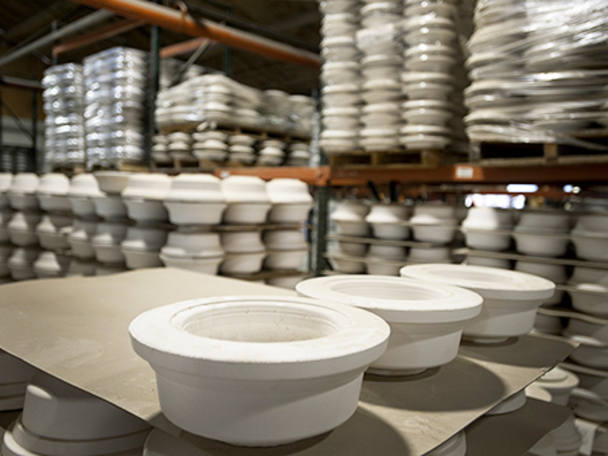
| Churchill China | CHH | 34.7 |
| Bioventix | BVXP | -0.4 |
| Photo-Me International | PHTM | 6.6 |
| Avon Rubber | AVON | 2.5 |
| Porvair | PRV | 15.2 |
| Average | - | 5.4 |
| FTSE Small Cap | - | 2.3 |
| FTSE Aim | - | -0.7 |
| FTSE Aim/Small Cap | - | 0.8 |
Source: Thomson Datastream
While most of the share prices appreciated during the year, the collective performance was marred by a disastrous year for Sepura (SEPU). The Cambridge-based communications technology group, which returned 12 per cent to shareholders when it matched the screen's criteria in 2014, saw its shares tank 65 per cent this time around after being stung by profit warnings in April and June 2016.
Overall, the 11 FTSE Small Cap and Aim stocks that met the high-quality conditions last year produced an average total return of 5.4 per cent. That's a big premium on the two indices those companies were drawn from, which delivered a weak combined performance of 0.8 per cent. Nothing to be sniffed at, of course, especially when you factor in the sharp post-EU referendum sell-off in stocks with heavy UK exposure, but the screen has again failed to match the outsize performance demonstrated in 2012-13 and 2013-14, when it returned 36 per cent and 28 per cent respectively.
A buy-and-hold strategy for either of those portfolios would have worked well, too, with the 2012 picks now up 124 per cent, and the 2013 screen 60.8 per cent higher (see table below). The 2013 performance is particularly impressive when you consider that one of the five shares selected was Globo, the mobile solutions business that went bust last year after its chief executive admitted falsifying data and lying about the company's financial position. Incidentally, Globo's travails are an important lesson in the limits of screening, which can give the impression of value by ticking the classic investment ratio boxes while disguising operational or accounting issues. Indeed, this was one of the main reasons why so many investors were lured into the Globo value trap.
| Buy-and-hold strategy | ||
|---|---|---|
| Screen (%) | FTSE Small Cap/Aim (%) | |
| 2012 | 124.3 | 42.2 |
| 2013 | 60.8 | 16.0 |
| 2014 | -5.9 | 7.0 |
Source: Thomson Datastream
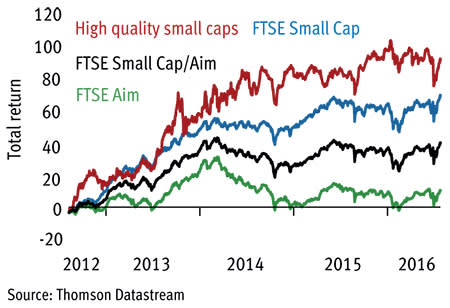
On a cumulative basis, the screen is still delivering. Assuming the portfolio is reinvested each year, and applying a 2 per cent annual charge to account for the sometimes painful costs associated with small-caps' bid-offer spreads, the High-Quality Small-Caps screen has produced a total return including dividends of 79.1 per cent over four years, or more than double the 37.8 per cent achieved by the FTSE Small Cap/Aim comparator.
High quality small caps vs FTSE Small Cap/Aim
Determining what has been key to the success of this screen is a little tricky, as the portfolio is determined not only by two archetypal measures of quality stocks, but also by valuation. To meet the latter criteria, the screen firstly gets rid of shares in the top fifth of price/earnings ratios - thereby excluding companies that might have toppy valuations - while eliminating the lowest fifth of the range to avoid stocks that are 'cheap for a reason'.
A further test of value is then applied, which we refer to in the table below as 'genuine value' (GV). This is calculated as a cash-and-dividend adjusted price/earnings growth (PEG) ratio in the table's eighth column. The GV ratio looks at a company's enterprise value (market capitalisation, plus debt, minus cash), against operating profits, and is also used to judge the expected earnings growth rate plus dividends.
The High-Quality Small-Caps screen then looks for shares that meet two much-loved metrics of operational integrity - high operating margins and high returns on equity. Neither test is a precise barometer for quality, although collectively they should provide a decent indication of companies that are either highly operationally efficient or have a competitive advantage, and which are able to make good returns with limited capital, thus allowing them to expand rapidly. On each count, the stocks must record a higher than median average score in each of the past three years.
The full screening criteria is:
■ PE ratio above bottom fifth and below top fifth of all stocks screened.
■ Lower than median average GV ratio.
■ Earnings growth forecast for each of the next two years.
■ Interest cover of five times or more.
■ Positive free cash flow.
■ Market capitalisation over £20m.
■ Higher than median average return on equity (RoE) in each of the last three years.
■ Higher than median average operating margin in each of the past three years.
■ RoE growth over the past three years.
■ Operating margin growth over the past three years.
■ Operating profit growth over the past three years.
It is becoming a familiar theme of the High-Quality Small-Caps screen, but the 'quality' generated still throws up companies whose valuations suggest a less than convinced market. Although they have some strong defensive characteristics and a good recent track record of generating a good return on equity, both Epwin and Utilitywise would fall into this category.
This year, the screen has found 10 stocks in the FTSE Small Cap and Aim, which meet all of the criteria set out above, although to call them an entirely new set of investment ideas would be to ignore the selection of Brainjuicer, Utilitywise and Photo-Me International, all of which appeared in last year's screen. The cheapest quartet of stocks that achieved a GV ratio below 0.5 are profiled below, while the remainder are published in the table that follows.
Somero Enterprises
Somero Enterprises' (SOM) product range - laser-guided machines for levelling concrete - is fairly niche, but that matters little considering the Florida-headquartered company's market dominance. Since the 1980s, Somero has amassed a 99 per cent share of the global concrete-levelling equipment market, supplying flooring contractors and construction groups in more than 90 countries with machines and training. It is also an exceptionally well-run cyclical business, which could soon dramatically scale up if management makes a success of its entrance into the largely untapped Chinese construction market.
Its market supremacy and brand helps to explain the excellent gross profit margin, which last year was bolstered by price increases as well as improved productivity. A sticky client base also means that operating cash flows are solid. These, together with recent positive trading conditions in North America and further margin improvement, led the company to predict it will beat market expectations for the year to 31 December 2016 (last IC view: Buy, 152p, 10 Mar 2016).
Epwin
Expectations for the home improvement market have decidedly soured in recent months, but building materials supplier Epwin (EPWN) is confident it can hit the heady expectations set for it by the market. Looking at the fundamentals, it's not hard to see why. Last year, a cash conversion rate above 100 per cent helped it to book earnings before interest and taxes of £19.7m, in turn allowing a stonking increase in the full-year dividend.
However, the contraction in revenues from the fabrication and distribution business, which accounts for customers' big-ticket items, such as window frames, means investors are distinctly nervous about the group's ability to maintain its earnings profile. Whether dampened consumer confidence can be offset by buying in new product ranges is a moot point, although if Epwin can meet analyst forecasts the shares are likely to step up from their current rating, which at seven times forward earnings look 'cheap for a reason' rather than just cheap (last IC view: Buy, 133p, 15 April 2016).
Utilitywise
It would not be hard to accuse Utilitywise (UTW) of being a classic Aim stock for the wrong reasons. It claims to be a disruptive, high-growth business and describes itself as an "independent utility cost management consultancy offering energy procurement management products and services". It recently signed a deal with US tech giant Dell to pivot into the much-hyped 'internet of things'. And it has faced criticism for the way it has recognised sales in the income statement.
The group has also grown earnings at a heady pace, and can boast an average return on equity of 33 per cent for each of the past three years, without seeing a significant expansion in debt. However, we have previously flagged the cash conversion rate, a feature disguised by our screen, which only looks at the £4.4m of free cash flow reported in 2015 (last IC view: Hold, 180p, 19 Apr 2016).
Journey
Journey (JNY) has flown under the radar of Investors Chronicle until now, despite its exposure to the airline industry. That's likely due to its size, as only in the past year did it pass the £20m market capitalisation threshold that makes it eligible for this screen (and our companies results coverage). As the table below indicates, it also has a PEG ratio that suggests it has escaped the attention of many others in the market.
Journey makes its money providing in-flight catering to international and domestic airlines in the US and in-flight amenity kits and meals to the international carriers. This is a competitive sector, but one in which Journey has been able to carve out some respectable margins, demonstrated by last year's generation of $3.3m in pre-tax profit on sales of $63.6m. The company's earnings forecasts also recently received a shot in the arm following a major new contract with American Airlines at Los Angeles International Airport. Despite this, the share price hasn't quite caught up with the predicted hike in profits, or the relatively cash-flush balance sheet (last IC view: none).
| Name | TIDM | Mkt cap | Price | Fwd NTM PE | DY | PEG | GV ratio | FY EPS gr+1 | FY EPS gr+2 | 3-mth momentum | Net cash/debt (-) |
|---|---|---|---|---|---|---|---|---|---|---|---|
| e2v Technologies | LSE:E2V | £480m | 220p | 15 | 2.5% | 2.73 | 1.46 | 2.7% | 9.0% | 5.2% | -£21m |
| Photo-Me International | LSE:PHTM | £583m | 155p | 20 | 3.8% | 4.08 | 1.51 | 2.6% | 7.1% | -4.0% | £60m |
| Trifast | LSE:TRI | £157m | 134p | 13 | 2.1% | 3.07 | 1.70 | 4.7% | 5.3% | -3.3% | -£16m |
| Brainjuicer | AIM:BJU | £49m | 395p | 15 | 1.1% | 1.43 | 0.65 | 9.8% | 13.3% | 17.3% | £6m |
| Character | AIM:CCT | £104m | 485p | 10 | 2.7% | 2.36 | 1.00 | 1.0% | 7.9% | -4.9% | £15m |
| Epwin | AIM:EPWN | £139m | 98p | 7 | 6.5% | 0.88 | 0.47 | 15.8% | 3.5% | -24.3% | -£14m |
| IDOX | AIM:IDOX | £228m | 64p | 17 | 1.4% | 1.46 | 0.94 | 37.2% | 3.3% | 16.9% | -£14m |
| Journey | AIM:JNY | £24m | 199p | 11 | - | 0.66 | 0.35 | 44.4% | 5.6% | -0.5% | $4m |
| Somero Enterprises | AIM:SOM | £93m | 166p | 9 | 2.8% | 1.03 | 0.48 | 11.0% | 11.4% | 3.7% | $13m |
| Utilitywise | AIM:UTW | £109m | 139p | 7 | 3.9% | 0.43 | 0.31 | 27.4% | 13.0% | -19.8% | -£10m |
Source: S&P Capital IQ