
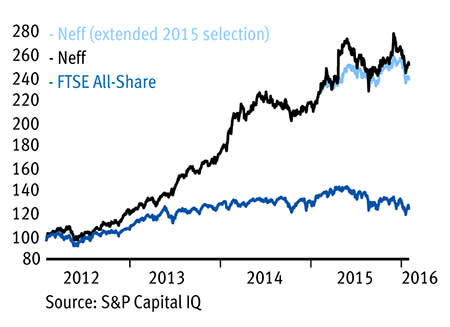
Despite the torrid market backdrop of the past 12 months, my Neff screen has once again delivered a solid return. True, 2015 can hardly be considered a knockout year for the screen, which is inspired by the investment philosophy of US fund management star John Neff, but a 10.6 per cent total return is a substantial level of outperformance compared with the negative 8.1 per cent from the FTSE All-Share. What's more, the strong showing makes it the fourth year in a row that the screen has managed a good level of outperformance.
There is a caveat with last year's performance, though. Only three shares actually passed all the screen's tests in 2015 (these three shares appear at the top of the 2015 performance table). Given this lack of diversity, luck can be considered to have played a major role in the 2015 outcome. Due to the limited number of results from last year's screen, I also published a list of the shares that passed the key Neff value test and met all but one of the other six Neff tests. While the performance from these shares (a 3.8 per cent average total return) was not as strong as the three fully fledged Neff picks, the return was nevertheless impressive compared with the market.
2015 performance
| Name | TIDM | Total return (9 Feb 2015 - 3 Feb 2016) |
|---|---|---|
| Pace+ | PIC | 25.2%* |
| Dunelm+ | DNLM | 12.9% |
| Travis Perkins+ | TPK | -6.3% |
| WH Smith | SMWH | 43.1% |
| Xchanging | XCH | 22.7% |
| Topps Tiles | TPT | 22.1% |
| VP | VP. | 20.3% |
| Sepura | SEPU | 14.5% |
| WPP | WPP | 7.1% |
| LondonMetric Property | LMP | 5.8% |
| ElectroComponents | ECOM | 2.7% |
| Next | NXT | 0.4% |
| Connect | CNCT | -0.7% |
| James Fisher | FSHR | -4.5% |
| PayPoint | PAY | -4.7% |
| Close Brothers | CBG | -14.2% |
| Paragon | PAG | -24.7% |
| BBA Aviation | BBA | -32.3% |
| Top 3 | - | 10.6% |
| Whole Screen | - | 5.0% |
| FTSE All Share | - | -8.1% |
*Taken over +All tests passed
Source: Thomson Datastream
Year-by-year performance
| Year starting Jan/Feb | FTSE All-Share | Neff screen |
|---|---|---|
| 2012 | 16.8% | 28.7% |
| 2013 | 10.2% | 39.1% |
| 2014 | 8.2% | 28.8% |
| 2015 | -8.1% | 10.6% |
Source: Thomson Datastream
Last year's performance takes the cumulative total return from the Neff screen since 2012 to 155 per cent, compared with just 28 per cent from the market. Factor in a 1 per cent annual charge to account for dealing costs and the return drops to 145 per cent. Also, if the performance in 2015 is based on the 18-stock version of the screen, the cumulative total return over the four years comes in at 142 per cent, or 132 per cent with the 1 per cent charge.
Neff versus FTSE All-Share
Mr Neff, who gained acclaim during his 31 years as manager of the Windsor Vanguard mutual fund, during which time the fund returned 13.7 per cent annually versus 10.6 per cent from the S&P 500, is often characterised as a value investor. I like to think of him more as an investor in steady-growth stocks who also has a keen understanding of value. The type of shares he looked for when managing the Windsor fund were typically reliable and often rather boring companies with the potential to be solid buy-and-hold investments.
The beauty of the Neff approach is that it asks for a lot from stocks at the same time as not asking for too much. For example, the approach looks for good but sustainable growth, which means eliminating both companies exhibiting very high growth, which is judged not to be sustainable in the long term, as well as those generating little or no growth. Earnings growth also needs to be backed by sales growth, which Mr Neff points to as the ultimate source of growth in the longer term.
The screen also tries to avoid two types of valuation risk by eliminating both the cheapest stocks on the market, which run the risk of being a value trap, as well as the most expensive stocks, which have the potential to derate sharply. In fact, my version of the screen arguably eliminates too many of the market's lowest PE shares, but the existing PE cut-off point has served the screen well so I'm sticking with it. The only stock on the list that would have scored full marks had the screen had a lower PE cut-off was Derwent London. As Derwent is a property company, the relevance of using PE to assess the valuation case is questionable as property company share prices tend more commonly to be compared with their net asset value (NAV) per share.
The full criteria is:
■ Historic price/earnings ratio (PE) below the most expensive quarter of shares and above the cheapest quarter. ■ A lower than median average Neff PEG ratio (see details below). ■ A five-year EPS compound annual growth rate (CAGR) of more than 7.5 per cent but below 20 per cent (excessive growth can fall off). ■ Average forecast EPS growth for the next two financial years of more than 7.5 per cent. ■ Rising EPS in each of the last two half-year periods. ■ Five-year turnover CAGR of 5 per cent or more (in the long term, earnings growth needs to be based on rising sales). ■ Positive free cash flow in each of the past three years. |
Mr Neff also has a very nice way of valuing the steady growth shares he looks for. He uses a version of a price-to-earnings-growth (PEG) ratio that also factors in dividends. In fact, Mr Neff liked to express this valuation formula as a yield, but I've flipped the formula on its head to make it look more like a PEG ratio, which I believe is a more familiar format for investors in the UK where Jim Slater did so much to promote its use.
The way I calculate the Neff PEG ratio is as follows:
Price-to-earnings ratio (PE) / Earnings growth rate (EPS growth) plus dividend yield (DY) In the formula I use a historic PE and DY. EPS growth is the average of the five-year compound annual growth rate (CAGR) and the average forecast EPS growth rate for the next two fiscal years. |
Once again, the screen has yielded few results from the FTSE All-Share (I've actually screened the FTSE 350 and the Small Cap separately to try to produce more positive results). I've provided write-ups of the two shares that passed all the screen's criteria below while a further 19 shares that passed the valuation test and all but one of the six other tests are listed in the accompanying table.
TOP NEFF SHARE PICKS