

My chart shows this. It shows the annualized inflation-adjusted change in house prices to June 2011 for every month since 1989. This shows that even if you had bought at the very best time - January 1998 - your annualized real gain would only have been 4.3 per cent. That's before insurance and maintenance costs. Had you bought 20 years ago, your real return would have been just 2.1 per cent per year.
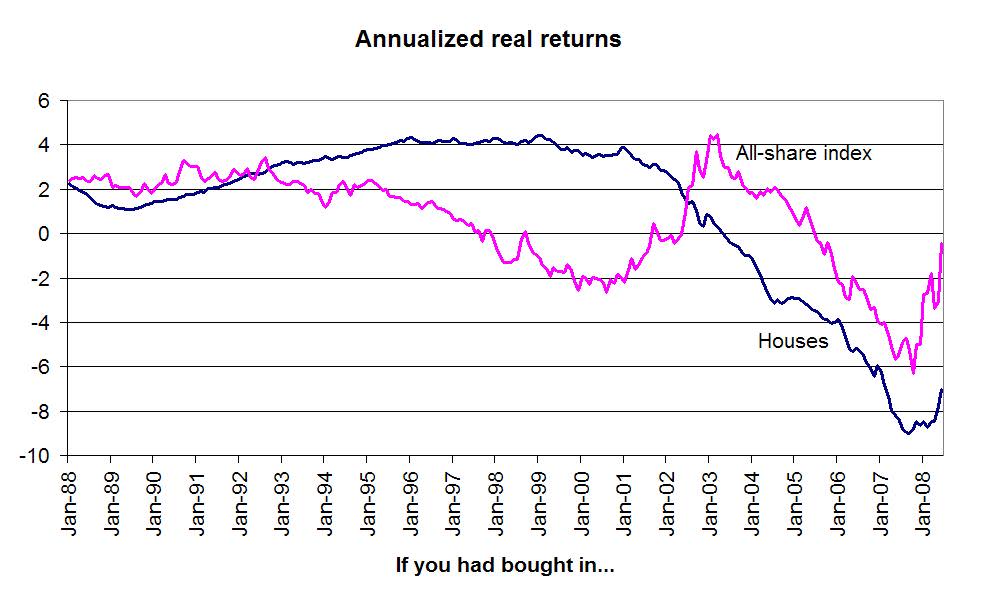
Relative to equities, this isn't terribly bad. Had you bought at any time between 1993 and 2002, you'd have done better in houses than shares*.
From another perspective, however, it is a poor showing. This is because houses are risky and their returns haven't been sufficiently high to compensate for this risk.
What matters here is not simply the volatility of house prices alone, the risk of their price falling. Other things equal, we can tolerate a loss on an asset if it comes at a time when our other assets - shares, our wage income, our own business, whatever - are doing well. What's much harder to bear are losses that come at the same time as our other assets are also doing badly.
And here's the problem. Losses on housing do often come just when other our other assets are also doing badly. Take, for example, those workers losing their jobs at the Bombardier factory in Derby. Because their income is falling, they need some wealth to fall back on. They need a cushion. But their houses are bad at providing this, because the same blow to Derby's economy that puts them out of work also reduces the value of their house. They therefore suffer a double loss.
In this sense, housing is a risky asset because it lets us down when we need wealth the most. To compensate for this risk, returns on housing should be high.
How high? Standard asset pricing theory gives us a way of calculating this. It says returns on any asset should be a product of four things:
- The volatility of the asset itself; how likely is it to fall?
- The correlation between the asset's return and "bad times": how likely is the asset to fall when we need our wealth the most? The standard measure of bad times here is consumer spending. Because a fall in consumer spending is a sign that people's incomes, wealth or income expectations are falling, it is the best simple guide to the state of people's entire portfolios of assets and earning power.
- The volatility of consumer spending; how likely are bad times?.
- How risk-averse are we? The more we hate risk, the higher are the returns we need to compensate us for taking it.
Let's put some numbers on these.
Take the volatility of house prices first. Since 1978, the standard deviation of real annual changes in Nationwide's house price index has been 9.1 per cent. But we don't buy the index. We buy specific houses. And just as individual shares are riskier than the All-share index, so individual houses must be riskier than the house price index. How much riskier is an under-explored question. Let's assume, though, that there are twice as risky, so volatility is 18.2 per cent.
The correlation between annual changes in house prices and in consumer spending since 1978 has been 0.69. This gives us our second number.
The volatility of consumer spending is a trickier issue. Since 1978, the standard deviation of aggregate annual spending growth has been 2.5 per cent. But of course, our individual incomes are more volatile than this. How much more so naturally varies hugely from person to person, and is hugely skewed: our wage incomes often show steady small annual gains, but with some chance of a large loss if we lose our job and cannot quickly get one as well paid. Let's say individual spending is three times as volatile as the aggregate, giving us volatility of 7.5 per cent.
Finally, there's the issue of the coefficient of risk aversion. This is estimated in such a way that one represents risk neutrality and higher numbers greater risk aversion. The existence of a gambling industry points to a low number, but the existence of the insurance industry and welfare state to a higher one. One recent study of Italian investors has found that the average coefficient of risk aversion is 4.2 with, as you'd expect, huge variation from person to person. Are the British more risk-averse than this? Our driving habits suggest yes, but our gambling habits no. Let's go with this.
Multiplying these numbers together gives us: 0.182 x 0.69 x 0.075 x 4.2 = 0.04, or four per cent.
Only if you had bought at the best possible time in recent years would you have enjoyed a better return than this - and even then, only slightly so. For many other holding periods, returns have been worse than this.
In this sense, houses have not delivered returns sufficient to compensate for their risk. Nor are they likely to do so in the foreseeable future; few people expect house prices to rise four per cent a year after inflation (that is, around six per cent before inflation) in the next few years.
But haven't houses done better than shares in this respect?
No. There's one big difference between shares and houses. Equity returns are less well correlated with consumer spending than are houses; a correlation of just 0.19 since 1978. Sometimes - such as in 2000-03 - the stock market does badly when the economy generally is doing OK, which makes equity losses easier to bear than housing losses.
If we plug this low number into the calculation above, and assume equity volatility of 20 per cent, we get: 0.2 x 0.19 x 0.075 x 4.2 = 0.014, or 1.2 per cent. For many holding periods, though, shares have done better than this, especially if you'd reinvested the dividends.
Of course, you can quibble endlessly with these numbers. I've ignored taxes, insurance and maintenance costs and also liquidity risk; it's usually easier and cheaper to sell shares quickly than houses. All this would increase the arguments against housing as an investment. On the other hand, there are some people for whom the calculation points to housing being a better investment. If the risks to your income are less correlated with the risks to your house price - say because you're retired and so don't face the danger of losing your job at a time when house prices fall - then housing is less risky for you than others, for example.
The point is, though, that for many people housing has been a bad investment, in the sense that its returns have been poor relative to its risks. This is all the more true because, for many, housing is a highly leveraged investment. You wouldn't borrow three times your income to buy an equity tracker fund, so why do so to buy a house?
The answer, of course, is that housing isn't just an investment but also a consumer good and sometimes at least, it is better to finance that consumption by borrowing than renting. But nice consumer goods needn't be good investments as well.
* My chart excludes dividends just as it excludes rents. If you'd reinvested dividends, then housing, excluding rent, would only have out-performed shares if you'd bought between 1998 and 2001. The chart stops in June 2008, simply for aesthetic reasons; annualized returns since then have been so noisy they make the chart look ugly. Since then, though, shares have generally out-performed houses.


