
A bull or bear market is very much like a military campaign. The index is constantly trying to defend territory that it has already taken and move on to attack new highs or lows. As with any fighting force, it is essential that troops and the generals move together as one unit. If they become separated, it weakens the war effort and eventually leads to a reversal.
If an equity index is an army, then the troops are its many smaller members and the generals its biggest and most influential members. In the case of the FTSE 100, the top 10 companies make up a whacking 45 per cent of the index's total market value. They are clearly its generals. The troops - the remaining 90 firms - account for the rest of its capitalisation.
To see if the troops and generals are marching forward together, we use the concept of breadth. There are several different ways to measure breadth, but one of the easiest and most effective is the 'advance-decline line'. This is an indicator that simply compares the number of index members that have risen on a particular day with the number that have fallen.
An advance-decline line is constructed as follows. Say 60 of the shares in the FTSE 100 go up on a given day, while the remaining 40 go down; 60 minus 40 equals 20. That net figure of 20 is then added to the indicator. If on the following day, 45 stocks rise while the other 55 fall - a net decline of 10 - we subtract 10 from our indicator.
You can easily perform this yourself by hand, although the process is obviously time-consuming. However, most decent charting software packages come with an advance-decline indicator built in, and going back over several years.
In the lower panel of the accompanying chart, the advance-decline line - or 'A-D line' for short – is plotted. You can also display it as a ratio - ie, with advances divided, rather than subtracted by, declines. I am simply more used to doing it the first way.
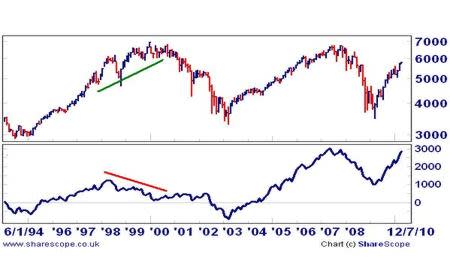
If the market is rising, and the troops and the generals are moving forwards as one, the A-D line will show a rising trend. Or, if the index is falling, and most of its members are falling, the line will be declining. At new price highs or lows, we ideally want to see the A-D line also at a new peak or trough.
Changes in the trend of the A-D line frequently occur in advance of changes in the overall direction of the market itself. It is therefore a useful 'early-warning' system. The line peaked in May 1998, some way ahead of the FTSE's sharp sell-off between July and October that year.
Subsequently, the FTSE recovered, heading to new highs towards the year 2000. However, throughout the index's ascent, the A-D line was steadily grinding downwards. What was happening is that the index's advance was being driven mainly by the generals, in those days a handful of extremely valuable technology and telecom companies. But many of the troops - the 'old economy' traditional stocks - were actually in retreat. By the time the FTSE 100 hit its all-time high in December 1999, the A-D line was at a three-year low, a clear warning sign of the internal weakness of the bull market.
The mutiny of the troops in the 1998-2000 period was an extreme occurrence. But turns in the A-D line have also helped signal the onset of other bull and bear markets. It turned up nicely just one week before the major bear-market bottom in March 2003. It then rolled over negatively in May 2007, a month or so ahead of the next significant peak.
As of today, the FTSE's troops and generals are standing united. When desertions from the campaign begin, it'll be a warning that the bulls may soon face their Waterloo.


