S&P's modest pullback

The main stock market indices I cover have been in a correction now for more than a month. The S&P 500 and FTSE 100 experienced their most recent highs on 2 August, and the DAX on 12 August. Since then, they have fallen by less than 5 per cent, even at their very worst points.
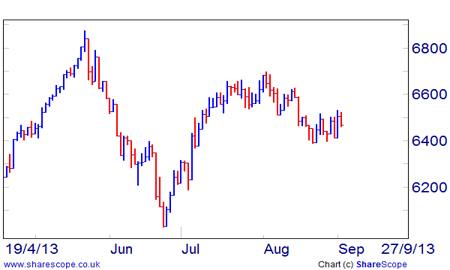
FTSE's modest correction
On the charts, this counter-trend looks like a halting and jagged affair. Compare that to the gains that came before, which were sharp and thrusting. I often refer to this phenomenon in my daily outlooks. But it's handy to put a number on these things. That's where the concept of efficiency comes in. So, meet the Efficiency Ratio.
Efficiency in action
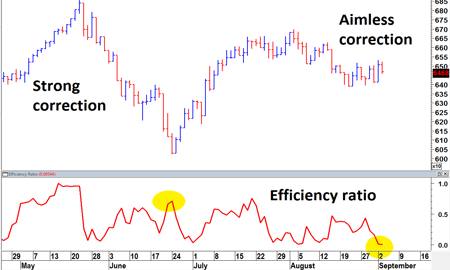
The Efficiency Ratio is a tool thought up by Perry Kaufman, a leading American systematic trader. It measures how directly a trend is unfurling in either direction over a certain period. Its readings range between 0 - for a market that's going nowhere - and 1 for a market that's going full steam ahead.
The FTSE 100's ER had drooped to around 0 as of the close on Tuesday 3 September. In the rally to early August, the ER reached as high as 0.75. In a real downtrend, like that of May-June, the reading can get up to 1. What I would say that today's enfeebled score means is that this is a market in reluctant retreat.
I understand some traders use high readings to exit positions, based on the insight that really strong trends can last only so long. It certainly does seem to be the case, at least anecdotally, that strong trending periods beget periods of stagnation and vice versa. And I remain of the view that today's stagnation will give way to another strong up-move.
Understandably, I detect impatience among traders for something to happen. It feels like we've suffered long enough already. I would point out that we've had much longer lulls, even in this bull market. Think back to last autumn, when the FTSE went sideways in a tight band of less than 200 points for two entire months.
The eventual breakout from the range of late 2012 was well worth the wait. After 10 trading weeks in which the FTSE travelled a net 3.48 per cent, the index exploded higher by 16.5 per cent in sixteen weeks. I suspect that the next leg up in the FTSE could easily target fresh record highs above 7,000.
Of course, even while the FTSE went nowhere last autumn, other indices were in livelier mode. One possible alternative I've been eyeing up just lately is Japan's Nikkei 225. It's not one I typically trade, mainly because of the unsociable hours at which most of the action plays out.
Nifty Nikkei
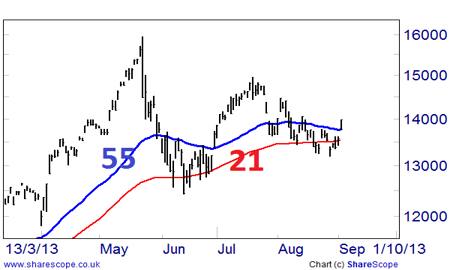
Having made its bull-market highs today back in May, the Japanese index has experienced a bear-market decline of 22 per cent and remains today some 12 per cent below that earlier peak. Tuesday's gap upwards on this index is clearly a positive development. Given a moving average crossover, the case for going along will be cemented.