

Early June 2009 was a great moment to buy shares. The indices had begun to rebound strongly from their catastrophic credit-crunch collapse. Over the next eleven months, America’s S&P 500 and our own FTSE All-Share both gave a total return of around 28.5 per cent. Hindsight is a wonderful thing, of course. A lot of people – myself included – were still fearful back then that the slump wasn’t over. However, a tried-and-tested buy-signal was actually flashing brightly at that moment.
The Coppock indicator has been featured in the Investors Chronicle since 1963. This tool aims to confirm when a market has formed a major low and has likely entered a new bull market. Not only did it do this in 2009, but also in April 2003, not long after the start of a boom in equities that lasted for four years, and which saw US and UK large-cap stocks deliver total returns of 81 and 111 per cent.
Coppock's S&P buys
Had I heeded Coppock’s buy signals on those occasions, I would have joined the new bull markets much earlier than I actually did, and would have made much larger returns. Those experiences made me to want understand Coppock better. In particular, I’ve always wanted to know what sort of returns this indicator would have produced across a number of markets had one followed its signals systematically over the years. In this article, I will reveal the answer and also Coppock’s current outlook.
Introducing Coppock
The Coppock indicator was the brainchild of Edwin ‘Sedge’ Coppock (1906-1989), a Texan who had his own financial market research firm. In 1962, he unveiled what he called his Very Long Term Momentum indicator in an article for Barron’s, the leading US investment magazine. His discovery – which also goes by the names of the Coppock ‘guide’, ‘curve’ or ‘indicator’ – sought to identify low-risk, long-term buying opportunities in the stock market.
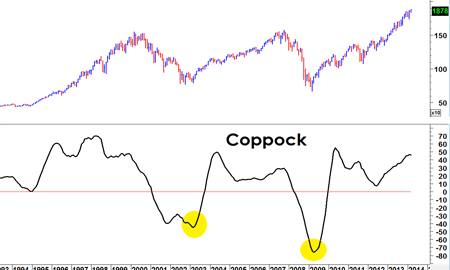
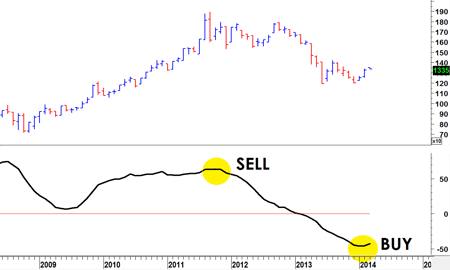
As its original name suggested, the Coppock indicator is a study of market momentum based on monthly price action. To calculate the indicator, the percentage changes in the market over the last 11 and 14 months are added together. Next, a 10-month weighted moving average of the sum of the 11 and 14 month percentage changes is taken. The result is a line which is then plotted below the price action on a chart, as in the above graphic.
A buy-signal happens when the Coppock indicator’s reading has fallen below zero, and then turns upwards. What causes this is a big drop in the market, followed by a significant initial recovery. So, the indicator is not about picking bottoms in the market, but confirming when one has already likely occurred, as in 2002 and 2009. The signals are therefore rare, but can be very effective indeed.
Coppock’s cop-out
Sedge Coppock intended his indicator purely as a device for determining great long-term buying opportunities in the stock market. He never meant it to be used for deciding when to sell. Latter-day disciples of Coppock – such as Steve Leuthold of Leuthold Weeden Capital Management – have argued that, while it can be used to spot when a market is losing momentum, it is not especially helpful for deciding when to get out of stocks.
To me, this is a big flaw. It’s all well and good having an indicator that tells us that a bear market is likely over and that now is a good time to buy again. But this implicitly assumes that we were smart or lucky enough to have sold up and dodged at least some of the bear market in the first place. In reality, though, what typically happens is that we stay long throughout a bear market, such that we cannot really benefit from the Coppock signal when it comes.
A holistic approach
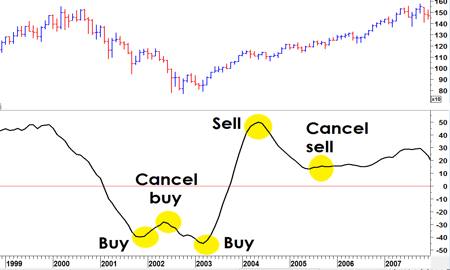
The traditional approach to analysing Coppock’s usefulness has focused on the gains that have followed buy-signals alone. I, on the other hand, have looked into a holistic investment strategy. Taking Sedge Coppock’s own calculation of the indicator with end-of-month closing prices – see inset box for more about this – I have explored the effects of following a strategy consisting of Coppock’s four implicit signals:
Buy: Switch from interest-bearing cash into a long position in the market every time the indicator turns upwards from negative territory below zero.
Cancel buy: Sell a long position and switch back into cash if the buy-signal is reversed, i.e. if the indicator turns back down while still in negative territory.
Sell: Sell a long position and switch into cash if the indicator turns downwards from above a reading of zero.
Cancel sell: Switch from cash back into a long position if the indicator turns upwards in territory above zero.
Coppock's four signals
All trades take place at the closing price of each month. I have assumed that investors earn the total return of the relevant market while they are long, and interest on cash holdings at a risk-free rate during out-of-the-market periods. This is almost certainly too conservative, as one should be able to earn interest on cash at a rather better rate.
Coppock: fit for purpose
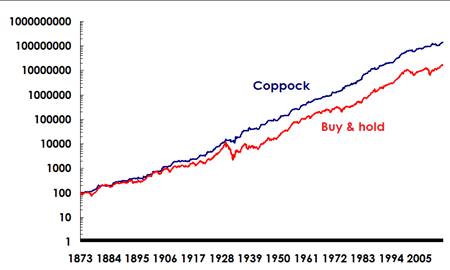
Sedge Coppock thought up his indicator specifically for the stock market. In his initial research, he found it had a perfect record of buy signals in the 1947 -1962 period. Nowadays, we can go back much further than he could, thanks to the work of Professor Robert Shiller, who has recreated price and total returns on the S&P 500 going back to 1871. So, I have applied my proposed Coppock-indicator switching-strategy to that index for the whole period.
Coppock wins at home
Total returns; data from Robert Shiller
Over time, a Coppock-based strategy would have beaten buy-and-hold by 1.6 percentage points a year on a total returns basis. What is more, investors following such an approach would have avoided the worst of the Great Depression collapse in stocks, among others. Over shorter periods, it would also have beaten Japan’s Topix by an annualised 1.4 per cent, Germany’s DAX 30 by a massive 3.1 per cent, as well as our own FTSE All-Share index by 0.5 per cent a year.
| S&P 500, 1871- (%) | Coppock | B&H |
|---|---|---|
| Total return | 10.5 | 8.9 |
| Best yearly return | 56.6 | 56.6 |
| Volatility | 8.8 | 14.2 |
| Worst drawdown | -29.3 | -81.4 |
| Time invested | 50.0 | 100.0 |
| Years when best | 38.6 | 61.4 |
| Signals/year | 1.6 | - |
| Cancelled signals | 34.8 | - |
| Current signal | LONG | - |
While a Coppock strategy beats the market over time, it nevertheless loses out to buy-and-hold in more calendar years than not. For example, while it beat the S&P comfortably, buying-and-holding the US large-cap index registered the better return in slightly more than 6 years out of ten. This was also the case for the FTSE All-Share, the Topix, and the DAX.
| FTSE AS, 1965- (%) | Coppock | B&H |
| Total return | 13.5 | 13.0 |
| Best yearly return | 80.6 | 80.6 |
| Volatility | 11.6 | 19.3 |
| Worst drawdown | -25.6 | -63.0 |
| Time invested | 46.4 | 100.0 |
| Years when best | 41.3 | 58.7 |
| Signals/year | 1.6 | - |
| Cancelled signals | 38.2 | - |
| Current signal | CASH | 0.0 |
Admittedly, Coppock has not worked out for all the indices to which I applied it. It has badly lagged the MSCI Emerging Markets index since 1990, by almost 5 per cent a year. It also narrowly underperformed the MSCI World index on by around 0.8 per cent since 1970. Since 1980, it has also significantly underperformed the Dow Jones industrials, by an annualised 3.2 per cent.
It clearly matters greatly which date one starts measuring performance from. I have used the longest possible series in each case to make the results as representative as possible. Contrary to received wisdom, it is clear that a great deal of the value of Coppock comes from its sell-signals. There is a huge benefit from dodging a bear market, and then getting back in when the uptrend resumes.
Great with natural resources
Coppock works well with the commodities I’ve run it with, too. Since 1970, its buy and sell signals have outstripped the performance of buying and holding the Goldman Sachs Commodity Index by more than a percentage point a year. It also hugely cut the amount of risk involved. The volatility suffered by investing according to Coppock was only two-thirds of that of buy-and-hold. The worst individual peak-to-trough decline suffered was 35.2 per cent, against 67.2 per cent for a permanently invested position.
| GSCI Total Return, 1970- (%) | Coppock | B&H |
| Total return | 8.1 | 7.0 |
| Best yearly return | 37.1 | 50.5 |
| Volatility | 13.2 | 19.9 |
| Worst drawdown | -35.2 | -67.6 |
| Time invested | 48.7 | 100.0 |
| Years when best | 37.5 | 62.5 |
| Signals/year | 1.7 | - |
| Cancelled signals | 36.2 | - |
| Current signal | CASH | 0.0 |
Coppock's golden streak
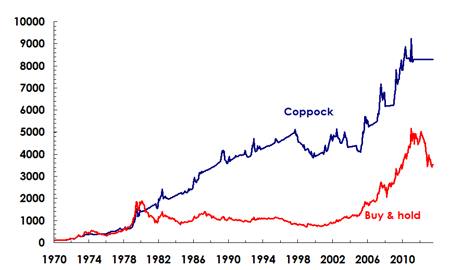
The GSCI index is heavily skewed towards energy, so I have applied Coppock’s signals to other areas too. Over time, it has led to superior returns with much lower risk in gold, livestock, and agriculturals. In the case of gold, investors gained from missing much of the long slump of the 1980s and 1990s. So, despite being invested for slightly less than half of the time since 1970, Coppock’s signals delivered a return of 10.7 per cent versus 8.5 per cent for buy-and-hold.
The bond bomb
Applying Coppock in the fixed income markets would have been much less rewarding. For the period since 1980, responding to its buy and sell signals would have produced worse returns than the UK and US 10-year government bonds, as well as the FT All-Stock Gilt index. Coppock did, however, help to cut the risks of investing in these various instruments. That’s small comfort, though, given that the risks were fairly small to begin with.
Coppock’s poor showing in bonds may have something to do with the period taken. Government bonds have been in a bull market for most of the time since 1980. During strong upwardly trending periods, Coppock naturally underperforms buy-and-hold, as it joins the up-move later and possibly exits earlier. As we have seen, Coppock’s signals come into their own during down-markets. I do not have total return data for bonds for the 1970s, when they were hammered by inflation.
How to apply Coppock yourself
On page XX, you can read our regular monthly overview of Coppock’s signals, which are based on the IC’s adapted methodology. A summary of the latest output according to the original calculations is shown in the accompanying table. Notably, gold gave a buy-signal in February, while the Dow Jone and MSCI World indices overturned their recent sell-signals.
If you want to keep a track of Coppock for yourself, though, all you need is a simple spreadsheet. I've
an example to our site. You can insert the monthly closing prices or average prices from Yahoo Finance or any other free service.Four weddings and a funeral
The development of the Coppock indicator was an impressive achievement in the days before computers. But legend has it that Sedge Coppock had some divine inspiration during his research. Believing bear markets to be a scarring event in investors’ lives, he asked the pastor at his local church how long parishioners typically took to recover from a traumatic experience, such as a bereavement or serious illness. The reverend estimated the healing process took between 11 and 14 months, which Coppock took as his moving average periods.
Whether this is true or not is unclear. I have yet to lay my hands on Coppock’s 1962 article, so am relying on hearsay. But it’s clearly a pretty eccentric touch, if it is indeed the case. Some more strait-laced fundamentalist investors have picked on this detail in order to try and undermine Coppock and technical analysis more generally. For me, though, what really matters is the effectiveness of a method, rather than the reasons behind it.
The Investors Chronicle has always published a slightly different version of the indicator to the one suggested by Coppock himself. Rather than the 11- and 14- month averages, we have instead used a single 12-month average. We have also calculated the indicator with monthly average prices, rather than end-of-month closing prices, as Coppock himself used. I have uploaded to our website a
one of the first ever IC pieces about Coppock written in 1963 by former editor Harold Wincott.My best guess is that Mr Wincott opted for a 12-month average back in the pre-computerised early 1960s for time-saving reasons. And he probably chose average monthly pricing either because the data was more readily available or because this adjustment produced slightly better results in back-testing at the time. For my part, I can see no reason today not to follow Coppock’s own approach of using 11- and 14- month data, as well as end of month. I am going to recommend that our monthly coverage switches to this method.


