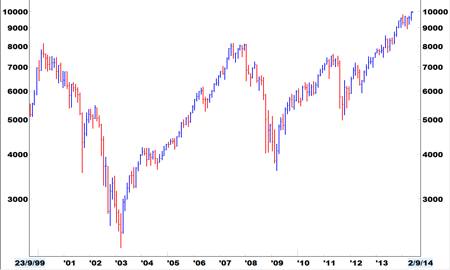
DAX heads for 5 digits
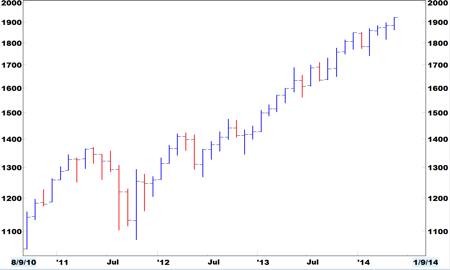
Soaraway S&P
Reader Will Nichols has written in asking me to look into whether the accomplishment of new highs is really as bullish as the momentum traders would have everyone believe. I understand where he's coming from. Especially to those of a value-investing bent, the idea of buying in at all-time highs after a five-year bull-run must seem counter-intuitive. Surely the time to buy is when an index is on its knees, like in early 2009?
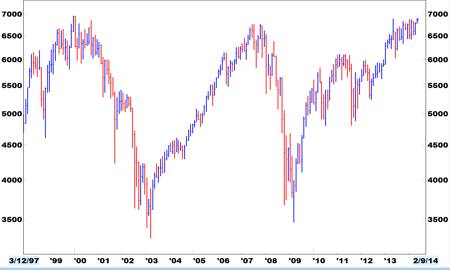
FTSE flirting with highs
Technical analysis is absolutely clear on this point: new all-time highs are bullish. When a price hits record levels, it obviously no longer faces any hurdles from past price levels. The recommended course of action, therefore, is to stay long and perhaps even to add to long positions. Like many trading rules of thumb, I have always taken it for granted that this is the case. Now, though, I have crunched the numbers to find out if history bears this out.
Going back to 1928, there have been 174 months in which the S&P 500 has closed at an all-time high. Measured from the opening price of the next trading session, the average gain over the following three months has been 2.1 per cent, compared with 1.7 per cent at other times. For a six-month holding period, the figures were 4 per cent versus 3.5 per cent. So, average returns are slightly better in the wake of record highs.
Just as returns are a bit fatter after all-time peaks, the likelihood of a positive outcome is also that much greater. Following a monthly close in 'blue-sky territory', there's roughly a 70 per cent chance of the S&P going higher over the next three months, compared with a 60 per cent chance at other times. Over a six-month period, the probabilities are 70 per cent against 64 per cent.
Peaks and valleys
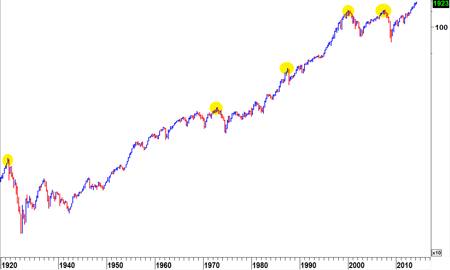
One reason that some people balk at going long at new highs is because they associate past record highs with certain big slumps that followed. Scanning charts with the naked eye can reinforce this tendency. After all, didn’t the peaks of 1929, 1987 and 2000 all give way to devastating declines in equities?
As is so often the case in technical analysis, however, what seems to be obvious to the naked eye doesn't stand up to statistical scrutiny. Bigger losses have been suffered more often in the months after non-record prices. The average worst loss during the six months after an all-time peak is 6.3 per cent compared with 8.7 per cent for other times. On a one-year view, the S&P's largest drop after a fresh peak was 45.6 per cent, but more than 70 per cent otherwise.
All in all, history suggests that new highs are a reason to be modestly bullish on the S&P's outlook, at least over the coming three to six months. By the same token, they don't really tell us much about the coming four weeks, which is clearly a more relevant timeframe for trading purposes. With the indices not yet looking especially stretched, ongoing upside seems a decent likelihood to me.