
Most investors tend to find a strategy that gels with them, which they then stick to. However, different approaches to stock-picking tend to fall in and out of favour depending on the market’s mood. Income investors have benefited over recent years, for example, due to investors searching for stocks with bond-like characteristics, which have been made to look more attractive by the low-yield environment. My strategy screen attempts to capitalise on the fickle nature of the market tastes towards different investment styles.
The screen’s done pretty well since I came up with it three years ago, although much of this comes down to a very strong initial 12-month performance period. Over the three years as a whole, the screen has delivered a cumulative total return of 58 per cent, compared with 13.5 per cent from the FTSE All-Share (see chart). If a 1.25 per cent charge is built in to reflect the costs of switching between portfolios each time a new screen is published, the cumulative total return drops to 52.1 per cent.

The markets over the past 12 months have not been kind, with the FTSE All-Share delivering a negative total return of 5.1 per cent. Against this backdrop, the fact that the screen is down just 1.3 per cent on a total return basis is not bad going.
| Name | TIDM | Total Return (17 Mar 2015 - 17 Mar 2016) |
|---|---|---|
| Hogg Robinson | HRG | 45% |
| TT Electronics | TTG | 35% |
| John Menzies | MNZS | 22% |
| UDG Healthcare | UDG | 22% |
| Petrofac | PFC | 14% |
| J Sainsbury | SBRY | 8.2% |
| Lookers | LOOK | 8.0% |
| Low & Bonar | LWB | 4.5% |
| Kier | KIE | -0.9% |
| International Consolidated Airlines | IAG | -5.3% |
| Pendragon | PDG | -6.1% |
| Galliford Try | GFRD | -6.7% |
| Robert Walters | RWA | -11% |
| Keller | KLR | -12% |
| Old Mutual | OML | -13% |
| Trinity Mirror | TNI | -19% |
| Findel | FDL | -20% |
| Thomas Cook | TCG | -34% |
| Evraz | EVR | -55% |
| FTSE All Share | - | -5.1% |
| Strategy Screen | - | -1.3% |
Source: Thomson Datastream
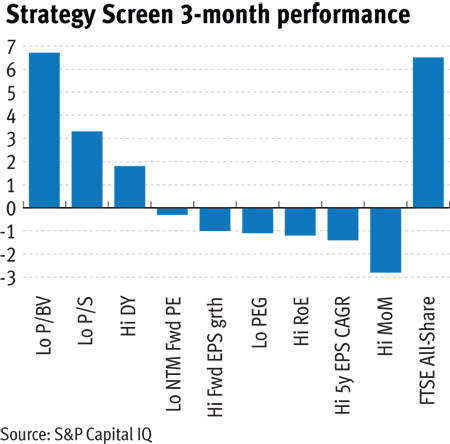
The Strategy Screen’s kick-off point is to look at several very basic fundamental factors to see which seems to have been best at predicting share price returns over the past three months. This year’s results from this part of the screen seem to strongly reflect the rally in resources stocks, with low price-to-book value shares – a key feature of resources stocks at the moment – being the only strategy to outperform the wider market. The performance of the various strategies can be seen in the bar chart. The strategies are based on the performance of the most attractively rated fifth of FTSE All-Share stocks based on each fundamental factor at the start of the monitoring period (ie, three months ago).
The next stage of the screen takes the three top-performing strategies of the previous three months – in this case low price-to-book-value (P/BV), low price-to-sales (P/S) and high dividend yield (DY) – and looks for any FTSE All-Share stocks that look attractive on these measures. Unfortunately, this year only one stock – Communisis – looks cheap based on all three top-performing fundamentals. To broaden the results, I’ve therefore also looked for low P/BV stocks that also appear cheap on just one of the other measures – P/S or DY. By relaxing the screen in this way I’ve managed to get 22 results, which are listed in the table. I’ve also included write-ups of some of the shares showing noteworthy characteristics, such as highest yield and lowest P/BV.
Strategy stock screen 2016
| Name | TIDM | Mkt Cap | Price | Fwd NTM PE | DY | P/BV | P/S | 3-mth Mom | Av. Fwd 2FY EPS grth | Net Cash/ Debt(-) | Test failed |
|---|---|---|---|---|---|---|---|---|---|---|---|
| EnQuest | ENQ | £110m | 14p | - | - | 0.24 | 0.18 | -27.8% | - | -$1.3bn | DY |
| Punch Taverns | PUB | £208m | 94p | 5 | - | 0.28 | 0.44 | -21.1% | -4.5% | -£1.6bn | DY |
| Enterprise Inns | ETI | £390m | 78p | 4 | - | 0.29 | 0.63 | -27.4% | -0.5% | -£2.3bn | DY |
| Petropavlovsk | POG | £236m | 7p | 6 | - | 0.33 | 0.17 | 7.1% | -4.6% | -$696m | DY |
| Lonmin | LMI | £413m | 146p | - | - | 0.36 | 0.45 | 102.9% | - | -$185m | DY |
| Premier Foods | PFD | £258m | 31p | 4 | - | 0.36 | 0.30 | -12.3% | 4.1% | -£587m | DY |
| Equiniti | EQN | £433m | 144p | 9 | - | 0.41 | 0.21 | -16.7% | 12.8% | -£239m | DY |
| Cambian | CMBN | £121m | 66p | 7 | 2.8% | 0.44 | 0.42 | -54.7% | -9.5% | -£231m | DY |
| Premier Oil | PMO | £217m | 43p | - | - | 0.44 | 0.30 | -8.4% | - | -$2.2bn | DY |
| Anglo American | AAL | £6.8bn | 487p | 27 | - | 0.56 | 0.45 | 76.8% | -10.0% | -$10bn | DY |
| Trinity Mirror | TNI | £414m | 148p | 4 | 4.2% | 0.61 | 0.63 | -9.6% | 3.1% | -£92m | DY |
| Drax | DRX | £1.1bn | 266p | 163 | 2.1% | 0.67 | 0.35 | 15.9% | -71.1% | -£187m | DY |
| Communisis | CMS | £91m | 44p | 7 | 5.0% | 0.72 | 0.26 | 9.4% | 12.0% | -£30m | na |
| Glencore | GLEN | £20bn | 141p | 38 | - | 0.72 | 0.16 | 69.8% | - | -$42bn | DY |
| HSBC | HSBA | £89bn | 453p | 10 | 7.9% | 0.76 | 2.31 | -13.0% | 1.7% | $267bn | P/S |
| Just Retirement | JRG | £783m | 139p | 11 | 3.1% | 0.77 | 0.28 | -14.4% | - | -£143m | DY |
| HSS Hire | HSS | £124m | 80p | 18 | - | 0.78 | 0.41 | 31.6% | - | -£188m | DY |
| Flybe | FLYB | £136m | 63p | 25 | - | 0.79 | 0.23 | -28.2% | - | £68m | DY |
| Firstgroup | FGP | £1.1bn | 94p | 9 | - | 0.80 | 0.20 | -10.9% | 12.3% | -£1.7bn | DY |
| Lamprell | LAM | £354m | 104p | 9 | - | 0.80 | 0.69 | 14.2% | -25.9% | $303m | DY |
| Speedy Hire | SDY | £177m | 34p | 30 | 2.0% | 0.80 | 0.49 | -1.4% | -31.2% | -£103m | DY |
| Stobart | STOB | £348m | 101p | 41 | 5.9% | 0.83 | 2.81 | -4.2% | 16.6% | -£52m | P/S |
Source: S&P CapitalIQ
TICKING ALL THE BOXES


