

What price optimism? Essentially this is what share prices represent; the amount investors are prepared to pay now for the future growth and cash flows of companies. In a low interest rate world, however, the price of many developed stock markets has been less about confidence in corporate earnings growth, and more a reflection of record-low yields from less risky assets such as treasury bills and benchmark 10-year government bonds, which has driven investors towards equities. Not underpinned by expanding profits, many moderate to highly priced developed equity markets look unlikely to match the returns of the past.
Buy low, sell high is one of the oldest maxims in investment and with developed markets inflated by several rounds of quantitative easing (QE) by major central banks, the hunt for the cheapest markets is global. By using backward- and forward-looking valuation techniques we can uncover opportunities which, thanks to low-cost exchange traded funds (ETFs), are nowadays much easier to invest in.
Cheapest markets by the backward looking CAPE measure
The price to trailing 12-month earnings (PE) and price to book value (PB) ratios are familiar multiples in equity valuation and aggregated figures are often used as valuation measures at the index level. When PB has been below average in the past, market returns have subsequently been strong. The trailing PE is a slightly less reliable indicator, as it is often caught out by shifts in the economic cycle. When earnings are at the peak of a boom, the share price can look reasonable when, in reality, it is high. Likewise at the trough of a recession low earnings can make a low share price seem expensive.
In response to these limitations, Professor Robert Shiller of Yale and Professor John Campbell of Harvard designed the cyclically adjusted price/earnings ratio (CAPE). This measure divides the current market price of an index by the average of inflation-adjusted earnings over a longer period of time (most commonly 10 years, but other timeframes can be used), which has the effect of smoothing out economic cycles. There is an observed tendency for CAPE mean reversion and market falls have often occurred after CAPE has risen above its average level.
The charge frequently levelled against CAPE is that it is rather a blunt tool for market-timing purposes. Prices can be expensive for some time before a market peak is reached, and if the ratio is used as a sell signal, significant upside can be missed. Equally, when CAPE is low there is the danger of a value trap. Some famous investors, such as Mebane Faber, have focused on using the measure to compare markets with one another, rather than against their own historical averages. Mr Faber’s tactic of buying baskets of the cheapest markets according to CAPE has outperformed over time, although this involves proportionately higher exposure to less stable economies; something many private investors may not be comfortable with.
Although CAPE is relatively straightforward to compute, reliable figures for past index earnings are not always readily available and values can differ depending upon which data source is used. The most authoritative CAPE for the S&P 500 is provided by Professor Shiller who, using data from Standard & Poor’s, has the index trading on 26 times its mean 10-year real earnings. A useful resource for comparing CAPE across a number of markets is provided by German asset management firm Star Capital. It uses Thomson Datastream indices for its analysis, so it has a slightly different figure of 24.6 for US CAPE, but the important thing is the consistent methodology and treatment of data.
Taking the Mebane Faber approach and comparing CAPE values for different markets directly, according to the Star Capital CAPE data, the US does look expensive. Of the markets we have chosen to focus on, only Ireland is dearer. The cheapest markets are Russia, Brazil, Poland and Turkey. Of course, sometimes markets are cheap for a good reason, so investors need to assess other metrics to establish true value. One method is to look at how the market is pricing risk.
The equity risk premium
Investors buy shares because the trade-off for risk is a potentially higher return than is available on safer assets. One of the ways to value shares, therefore, is by looking at the spread they offer over a default risk-free rate of return such as short-term treasury bills or benchmark government bonds. The difference between the total return on shares and the risk-free rate is the equity risk premium (ERP). If some markets are priced to offer more of a premium than others, it follows that they are either better value than peers, or they represent a speculative high risk-reward opportunity.
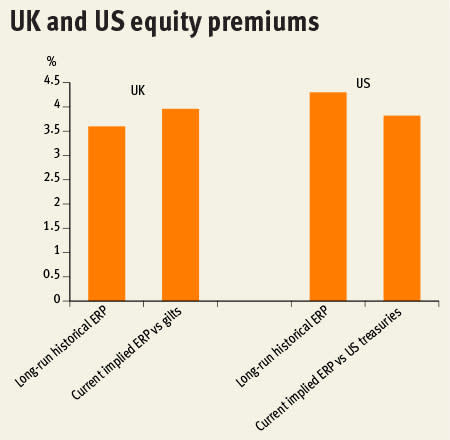
There are two main ways to calculate ERP, the historical and implied methods. The more straightforward is the historical premium, which is the difference between long-term annualised returns of an equity market and the long-term risk-free rate. According to data (1900-2015) from London Business School economists Dimson, Marsh and Staunton, the US equity risk premium over benchmark 10-year government bonds is 4.3 per cent a year. For the UK the equivalent figure, over 10-year gilts, is 3.6 per cent. Based on current bond yields, this would suggest we should model strategically, for annualised nominal returns of around 6 per cent from the US stock market and 5 per cent from the UK.
Although these estimates are useful when deciding on a portfolio’s strategic asset allocation, to compare the current pricing of risk (and therefore which markets are good value now) the implied ERP should be used. This forward-looking measure is estimated from the current index price and analysts’ forecasts of earnings growth. The discount rate that must be applied to future index cash flows so that they total the current index price is implicitly the required rate of return on equities. Subtracting the risk-free rate from this figure gives the equity premium.
Using analyst estimates of future aggregate index earnings from Bloomberg, the current implied ERP for the S&P 500 (over 10-year treasury bonds) is 3.82 per cent and for the FTSE 350 the premium (over 10-year gilts) is 3.96 per cent. This makes the required annualised rate of return of US and UK equities 5.37 per cent and 5.07 per cent, respectively.
These figures are useful because they can be compared with the premiums priced for other markets (see box: ‘Finding a premium in global markets’). Based on premiums above the benchmark 10-year US Treasury bond, the pricing of some developed countries implies higher expected returns than for the UK or the US. The investment cases for Israel (6.58 per cent implied annual return), Italy (6.97 per cent), Japan (6.12 per cent), Poland (6.53 per cent) and Spain (6.73 per cent) are all worth examining further.
In emerging markets, China is priced for 7.08 per cent annual return and investors require 7.77 per cent from Indian equities. The highest premiums are for Russia and Brazil, representing the impact of commodity price volatility and diplomatic/political issues for both countries. Other economies on a wider premium include Asian tigers Malaysia and Thailand.
Best value markets on a composite CAPE and ERP measure
Combining our implied ERP calculations with the backward-looking CAPE valuations from Star Capital gives an overview of stock markets that look good value on a cyclically-adjusted earnings basis and their inherent riskiness according to market participants.
The global markets we analysed are listed in the table on the right. Those that combine lowest CAPE and highest implied ERP are at the top. Expensive markets are flagged purple and very speculative markets are flagged pink. Please note that for comparison purposes, in the table the UK implied ERP has been recalculated using US treasuries rather than gilts as the risk-free rate.
Best value markets on a composite CAPE and ERP measure
| Country | Star Capital CAPE Score | Implied ERP (Investors Chronicle estimate) (%) | Implied required return (%) | US-listed ETF | US ETF ticker |
|---|---|---|---|---|---|
| Brazil* | 8.2 | 11.05 | 12.6 | iShares MSCI Brazil | EWZ |
| Russia* | 4.9 | 8.13 | 9.68 | iShares MSCI Russia | ERUS |
| Turkey* | 10.3 | 7.86 | 9.41 | iShares MSCI Turkey | TUR |
| Poland | 9.8 | 4.98 | 6.53 | iShares MSCI Poland | EPOL |
| Spain | 10.6 | 5.28 | 6.83 | iShares MSCI Spain | EWP |
| Italy | 11.1 | 5.42 | 6.97 | iShares MSCI Italy | EWI |
| China | 12.8 | 5.53 | 7.08 | iShares MSCI China | MCHI |
| Malaysia | 16.7 | 6.76 | 8.31 | iShares MSCI Malaysia | EWM |
| Thailand | 16.3 | 6.06 | 7.61 | iShares MSCI Thailand | THD |
| Indonesia* | 18.1 | 7.80 | 9.35 | iShares MSCI Indonesia | EIDO |
| India | 17.5 | 6.22 | 7.77 | iShares MSCI India | INDA |
| South Africa* | 19.1 | 8.68 | 10.23 | iShares MSCI South Africa | EZA |
| Israel | 15.2 | 5.03 | 6.58 | iShares MSCI Israel | EIS |
| South Korea | 12.8 | 4.38 | 5.93 | iShares MSCI South Korea | EWY |
| Hong Kong | 14.3 | 4.36 | 5.91 | iShares MSCI Hong Kong | EWH |
| Austria | 12.3 | 3.99 | 5.54 | iShares MSCI Austria | EWO |
| Mexico | 21.8 | 6.48 | 8.03 | iShares MSCI Mexico | EWW |
| United Kingdom | 12.7 | 3.49 | 5.04 | iShares MSCI United Kingdom | EWU |
| Taiwan | 18.3 | 4.75 | 6.30 | iShares MSCI Taiwan | EWT |
| Singapore | 11.5 | 3.32 | 4.87 | iShares MSCI Singapore | EWS |
| France | 16 | 4.11 | 5.66 | iShares MSCI France | EWQ |
| Germany | 16.8 | 4.30 | 5.85 | iShares MSCI Germany | EWG |
| Philippines | 21.9 | 5.69 | 7.24 | iShares MSCI Philippines | EPHE |
| Canada | 17.8 | 4.26 | 5.81 | iShares MSCI Canada | EWC |
| Japan | 22.7 | 4.57 | 6.12 | iShares MSCI Japan | EWJ |
| Belgium | 19.7 | 4.27 | 5.82 | iShares MSCI Belgium | EWK |
| New Zealand | 20.4 | 4.35 | 5.90 | iShares MSCI New Zealand | ENZL |
| Ireland** | 27.7 | 4.39 | 5.94 | iShares MSCI Ireland | EIRL |
| Netherlands** | 18.3 | 3.82 | 5.37 | iShares MSCI Netherlands | EWN |
| Sweden** | 18.8 | 3.82 | 5.37 | iShares MSCI Sweden | EWD |
| Switzerland** | 20.3 | 3.86 | 5.41 | iShares MSCI Switzerland | EWL |
| USA** | 24.6 | 3.82 | 5.37 | SPDR S&P 500 | SPY |
Sources: Star Capital (source data for CAPE from Thomson Datastream), Investors Chronicle (data for ERP calculation from Bloomberg)
The markets we have analysed were assigned a composite ranking based on the lowest CAPE according to Star Capital and the highest ERP according to us. On both measures Brazil and Russia look very cheap, but the exceptionally high risk premiums serve as a flashing red warning that these are markets to be avoided. Turkey also looks like a country that is not for faint-hearted investors, in spite of its long-term demographic advantages.
Poland, which is also cheap according to CAPE, has a far less alarming ERP. As mentioned previously, the market is pricing a return of 6.5 per cent for Polish equities, which is interesting given that they look inexpensive. Poland would fall into the category of good value as opposed to cheap for a reason. Other countries that could be classified similarly include Israel and South Korea.
The eurozone debt crisis still casts a shadow over Italy and Spain, but these are markets that represent a value opportunity at attractive premiums should a sustained recovery take hold on the continent. Of course, there is plenty of room for scepticism as many of the problems of 2012 were merely swept under the carpet. Some type of exposure through a broader European equity ETF, which would spread risk across other markets such as Germany, France and the Netherlands, might still be sought.
On a final note of caution, it is worth highlighting countries that look reasonably expensive according to CAPE, yet have a higher implied risk premium. These aren’t cheap and they are implicitly risky. With this in mind, investments in countries such as South Africa and Indonesia look highly speculative.
ETFs to play better value opportunities
The 32 countries that we chose to look at for our implied ERP analysis were selected because they are tracked by large and liquid US-listed ETFs and are therefore easy to invest in. This does of course introduce additional exchange rate risk and many investors will prefer to invest in broader regions using UK-listed ETFs. This approach also spreads risk across several markets although, as we have seen in several episodes of financial stress from the Asian crisis of the late 1990s through to the 2008 crash, many equity markets, especially regionally, are positively correlated with one another. In our recent Top 50 ETFs list, Investors Chronicle featured products that offer partial exposure to many of the markets listed here.
Investors Chronicle Top 50 ETFs that offer UK-listed access to value markets
| Ticker | ETF | Top exposure (% in brackets) |
|---|---|---|
| UC60 | UBS MSCI EMU Hedged GBP | France (33), Germany (30), Spain (10), Netherlands (8), Italy (6), Belgium (5) |
| XESC | db X-trackers Euro Stoxx 50 | France (37), Germany (32), Spain (10), Italy (6) |
| VERX | Vanguard FTSE Developed Europe | France (21), Switzerland (20), Germany (19), Spain (7), Sweden (6) |
| UB17 | UBS MSCI EMU Value | France (35), Germany (26), Spain (14), Italy (9) |
| EMIM | iShares Core MSCI Emerging Markets | China (20), South Korea (15), Taiwan (13), India (9), South Africa (6), Brazil (6) |
| EMV | iShares MSCI Emerging Markets Minimum Volatility | Taiwan (17), China (16), South Korea (11), Malaysia (8), Thailand (6) |
Sources: Investors Chronicle, Bloomberg
Managing risk and dynamic asset allocation policies
As important as which equity markets you invest in is the proportion of total funds that is committed to these risky opportunities, even if they are ostensibly good value. A circumspect portfolio will have a strategic asset allocation policy, with some cash set aside for liquidity needs and a blend of exposures to bonds, shares and other investments (such as property and gold) to match the investor’s risk tolerance, timeframe and objectives. The role of equities is to generate wealth, but the higher risks of investing in shares needs to be balanced out by other, less volatile investments.
In a low interest rate world, investors face a challenge in achieving modest return objectives without taking unacceptable risk. As a result, asset allocation is becoming more dynamic, with investors tilting their portfolios away from their strategic asset allocation policy in order to take advantage of short-term opportunities – although this does not mean that the portfolio strategy is abandoned.
Investing in cheaper markets is an example of taking tactical tilts. As part of a long-term strategy, UK investors will probably have an allocation towards their domestic equity market and, as the US market remains the largest and most important in the world, some exposure here may be a core holding. Professor Shiller himself has said that his CAPE ratio should not be taken as a signal to enter or exit the American market completely but as an indicator if allocation should be over or underweight. This approach seems eminently sensible; the US is expensive right now, but that has been true for a couple of years. Rather than exiting completely, therefore, it is better to proportionately reduce the exposure and increase positions in cheaper markets.
One way to think about dynamic asset allocation is in terms of a risk budget for portfolio objectives. If investors work on the assumption that overpriced markets will undershoot expectations, then they will look to the cheaper markets to deliver equity returns. In the first instance, investors should look at the best value markets with a similar reward-to-risk profile. If only riskier markets look attractively priced, then this additional risk needs to be compensated by changing the weighting of other asset classes in the portfolio.
For example, say a portfolio was 50 per cent bonds and 50 per cent equities, with the equity allocation all in the US market. Worried about punchy US valuations, an investor might choose to reduce this exposure and buy into the Spanish market. According to estimates from risk analytics firm PrairieSmarts, the Spanish market is likely to suffer a 50 per cent worse drawdown than the American market in a really bad month. Therefore, it would be sensible to reduce equities exposure overall, so that this risk could be mitigated by holding more bonds. The final asset allocation (this example is merely illustrative and has not been calculated scientifically) might be 60 per cent bonds, 20 per cent US equities and 20 per cent Spanish equities. The investor would have added risk in the form of the Spanish market, but as they expected a higher return than from the US shares alone they need less equities to achieve return objectives and can protect capital by transferring more of the portfolio into a lower-risk asset class.


