

Over the past few years, it has been increasingly difficult to find stocks offering compelling value. From a screening perspective, that often means that something else has to give if we are to find stocks that fit fixed valuation criteria. In the case of my Jim-Slater-inspired stock screen, I was lucky enough to get some input from the great man himself on how to deal with this issue before he sadly passed away at the end of last year.
From his point of view, the best way to adapt to a market that offered few, if any, quality growth stocks with a price-earnings-growth (PEG) ratios of 0.75 or less - a valuation criteria set out in Mr Slater's investment classic The Zulu Principle - was to accept a higher price if need be, but to make doubly sure the quality of the company was excellent. My screen last year, which prompted him to contact me, had taken the opposite approach by relaxing the quality criteria (I allowed stocks to fail one of the screen's 'quality' tests) while continuing to be stringent on the question of valuation.
Needless to say, my attempts to reflect The Zulu Principle approach in a stock screen now takes the comments from Mr Slater on board. This year, stocks must pass all the screen's quality criteria while having a price-earnings-growth (PEG) ratio - a valuation metric Mr Slater did much to popularise with UK investors - in the bottom quarter of all stocks screened. Meanwhile, the screen's central goal remains to find shares in promising small-cap growth companies at attractive prices.
The result from last year's screen was not actually at all bad. The 15 stocks picked managed to produce an 8.4 per cent total return between them, compared with a negative 5.0 per cent from a 50:50 split between the FTSE Small Cap and Aim All-Share.
2015 PERFORMANCE
| Name | TIDM | Total return (14 Jul 2015 - 30 Jun 2016) |
|---|---|---|
| 32 Red | TTR | 103% |
| Greenko | GKO | 57% |
| LifeLine Scientific | LSIC | 45% |
| James Cropper | CRPR | 44% |
| Shanta Gold | SHG | 27% |
| First Derivatives | FDP | 24% |
| XLMedia | XLM | 20% |
| Sirius Real Estate | SRE | 18% |
| Cambria Automobiles | CAMB | 7.6% |
| Character Group | CCT | 4.0% |
| MP Evans | MPE | -4.5% |
| Martinco | MCO | -6.0% |
| Utilitywise | UTW | -48% |
| Solid State | SOLI | -66% |
| Globo | GBO | -100% |
| Slater Small-caps | - | 8.4% |
| FTSE Small/Aim | - | -5.0% |
| FTSE Aim All-Share | - | -6.4% |
| FTSE Small Cap | - | -3.6% |
Source: Thomson Datastream
While the screen produced decent outperformance last year, on a stock-by-stock basis there was a wide range of results. The most noteworthy loser was the 100 per cent loss from Globo, which I pointed out in my write-up last year had failed the screen's important cash-generation test. As it turned out, this came down to the fact that the earnings that Globo was reporting were being grossly overstated. In many ways, a disappointment like this underlines the wisdom of Mr Slater's insistence on the importance of quality checks when targeting go-go growth stocks.
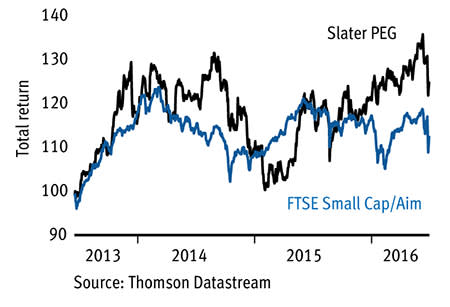
On a cumulative basis (switching between screen results on the day of publication each year), the screen has produced a 24.5 per cent total return over the three years I've run it, compared with 13 per cent from an Aim-Small Cap split. If I factor in a 2.5 per cent annual charge to account for the high dealing costs and spreads associated with small-caps, the return drops to 17.2 per cent.
Slater small caps versus FTSE
Screens are rather blunt instruments and some of the criteria my Jim-Slater-inspired screen uses are merely nods in the direction of the techniques he espoused in The Zulu Principle. For example, while Mr Slater told investors to look for director buying and encouraging outlook statements as signs that a company may be trading well, my screen simply looks for good three-month momentum as an indicator that the market feels positive, or decent earnings upgrades over the past year. The screen's full criteria are listed below.
■ A PEG ratio (PE divided by average forecast earnings growth for the next two financial years) in the bottom quarter of all stocks screened. It's worth bearing in mind that small-cap earnings forecasts are often not of the highest quality (nb FTSE All-Share, All Small and Aim have been screened separately). ■ Market cap of less than £500m but more than £10m. ■ Net-debt-to-cash-profits ratio of less than 1.5. ■ Cash conversion of 90 per cent or more. ■ Return on equity of more than 12.5 per cent or an operating margin of 15 per cent or over. ■ Three-month momentum higher than the median average, or forecast EPS upgrades of 10 per cent or more over the past year. ■ Forecast earnings growth in each of the next two financial years and average forecast growth of more than 10 per cent but less than 50 per cent (anything above 50 per cent is considered an unsustainable growth rate for the purposes of this screen). |
Six stocks passed all the screen's tests. They are listed in the table below and I've also provided some short write-ups of the companies.
Six Slater small-caps
| Name | TIDM | Mkt cap | Price | Fwd NTM PE | DY | PEG | EPS grth FY+1 | EPS grth FY+2 | 3-mth mom | Net cash/ debt (-) |
|---|---|---|---|---|---|---|---|---|---|---|
| Serica Energy | AIM:SQZ | £29m | 11p | 5 | - | 0.1 | 12.1% | 65.7% | 4.8% | $21.6m |
| Cambria Automobiles | AIM:CAMB | £65m | 65p | 8 | 1.2% | 0.5 | 36.5% | 5.5% | -14.7% | £0.3m |
| UK Mail | LSE:UKM | £175m | 317p | 15 | 5.2% | 0.5 | 40.0% | 13.6% | 2.2% | £2.2m |
| Lighthouse | AIM:LGT | £12m | 10p | 11 | 2.5% | 0.5 | 32.4% | 16.6% | -28.0% | £7.9m |
| Microgen | LSE:MCGN | £82m | 139p | 16 | 3.0% | 0.9 | 51.8% | 2.1% | -4.5% | £5.2m |
| Air Partner | LSE:AIR | £39m | 380p | 10 | 6.4% | 1.0 | 25.1% | 10.5% | 1.7% | £13.5m |
Source: S&P Capital IQ


