
How many people do you know who think the world is a safer, more stable place than it was 12 months ago? According to the Bulletin of the Atomic Scientists’ Science and Security Board, who have been setting their infamous Doomsday Clock since 1947, we are at just two-and-a-half minutes to midnight – the point at which humanity faces Armageddon. This is the most gloomy outlook since 1953 when the first hydrogen bomb was detonated and with the machismo foreign policies of Donald Trump, Vladimir Putin and Kim Jong-un you can understand why, in its 2017 report, the Science and Security Board implored that “wise public officials should act immediately, guiding humanity away from the brink”.
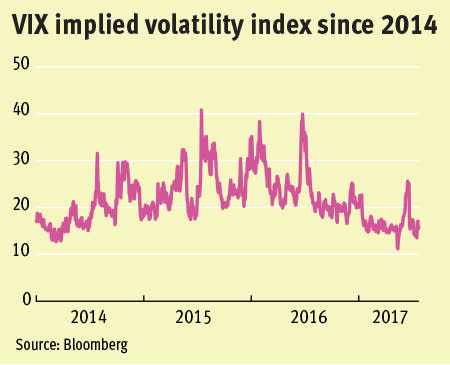
Financial markets, on the other hand, have been more sanguine since the turn of the year and the Chicago Board of Exchange Volatility Index (VIX) – known colloquially as ‘the fear index’ – actually fell below 10 in early May 2017 and, despite rising briefly, is back below this level again. What made this drop in implied volatility for S&P 500 options prices noteworthy was the striking disconnect between the obvious uncertainties facing the world and the apparent low level of concern amongst participants in the US options market. This raises important questions about the way we use volatility to express risk and whether there are other important indicators that should be given greater attention.
What do volatility indices actually show us?
In the first instance, it is important to be clear that the VIX is purely a measure of implied volatility. It is expressed as a percentage of how much the price of the S&P 500 is expected to change based on the rate of change in the price of options to buy or sell the equity index. The VIX is a weighted average of options within 30 days of maturity so it is a short-term measure of sentiment in the market, although the figure for implied volatility is annualised.
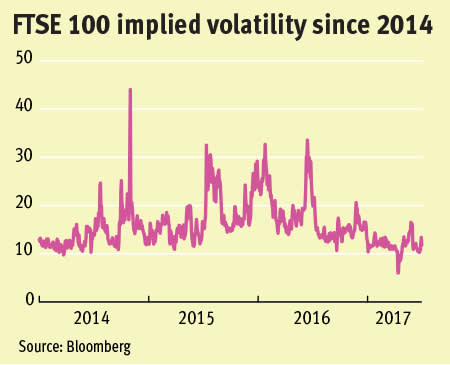
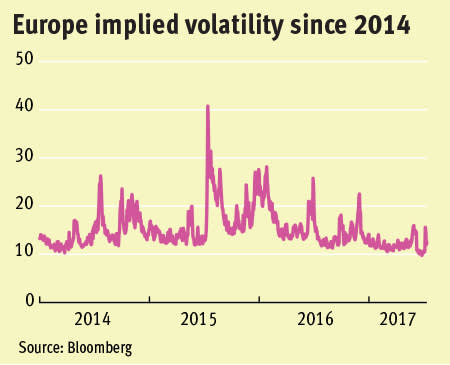
The VIX is the most famous volatility index and there are equivalents for Europe (the VSTOXX, which gives implied volatility for the Eurostoxx equity index) and the UK (the FTSE 100 IVI). In common with their US counterpart, these indices have shown remarkably little implied volatility in 2017, having not spiked since the result of the UK’s referendum on European Union membership last summer. Like the VIX, the reason they exist is to give institutional investors a way to measure and trade the fear factor in markets – they aren’t there to predict the future.
High implied volatility accompanies and quantifies uncertainty in the markets, but it represents an emotional reaction to the here and now, rather than a powerful indicator of where markets are heading. Similarly, the ultra-low implied volatility that we have seen in recent months shouldn’t be seen as a sign that markets will remain flat. Some recent press coverage asserts that there is a danger the opposite is true, given that the last time the VIX was at very low levels was in 2006-07, just ahead of the global financial crisis. Research by Morgan Stanley, however, shows that the idea we are just witnessing calm before a storm is oversimplistic. They highlight that the VIX falling below 10 in November 2006 preceded the credit crisis by months, so witnessing this level now is not necessarily a sign of impending market turmoil.
Realised volatility – the variation in actual price movements witnessed – has also been very low for the S&P 500 in recent months. The index made new record highs in May, but has crept up steadily and unspectacularly from already elevated levels, so the standard deviation has been low. This suggests the low implied volatility shown by the VIX is not a result of mispricing, so there must be underlying reasons why the market has been so calm. Investors should examine what those reasons might be to spot danger signs and opportunities, but taking low volatility as a sign to exit markets is counter-productive – especially when cash returns are easily outstripped by inflation.
Make sure you feel adequately rewarded, whatever markets you’re invested in
In the near term, low realised volatility corresponds to a muted rate of return, and this is probably the main point investors should take from the current low volatility phenomenon. Trying to time markets is a question of luck as much as judgement, so the crucial thing is to be invested in assets that offer a good rate of return, commensurate with how risky they are. In the case of the S&P 500 index, low volatility and the record price of the index implies a lower risk premium in the short term.
This question of compensation is crucial as placid markets shouldn’t be mistaken for a low-risk environment. When there is a trigger for a stock market fall (and who knows for sure what that will be or when it will happen), investors in shares need to remember that in the last two major bear markets, indices like the S&P 500 and the FTSE 100 lost around half of their value; rather like a dormant volcano, this risk is present whatever recent volatility metrics display.
Over the long run, the higher returns earned from shares have been ample reward for the periods when stock markets have suffered big peak-to-trough falls. The additional rate of return shares have made above the rate from supposedly risk-free assets, such as short-term high-quality government debt, is known as the equity risk premium (ERP) and the historically observed ERP is a powerful incentive to stay invested in markets and ride out any periods of downside. When high prices or low short-term volatility indicate a narrowing of the risk premium, however, investors should think about the proportions of their allocation in the most expensive markets and consider their approach to these exposures.
Adjusting for inflation, the global ERP over US 0-3 month Treasury Bills has been 4.5 per cent since 1967, according to the work of London Business School academics Elroy Dimson, Paul Marsh and Mike Staunton. This is based on a 5.3 per cent annualised real return from world equities and 0.8 per cent from T-Bills. The expectation is for developed economies that powered global GDP in the latter part of the 20th century, to grow less strongly over the next few years. This is reflected in the professors’ calculation that the prospective real ERP versus bills will be narrower at about 3 to 3.5 per cent.
Taking 3.5 per cent as a benchmark, we can say that we aren’t getting value for risk if the forward equity risk premium implied by stock market levels is less. The low volatility in markets is not a signal to exit markets, but it is a sensible time to assess positions to check if the level of compensation implied is attractive. The annualised yield on US 0-3 month T-Bills is 0.9 per cent, so right now you might be looking at equity valuations that suggest a rate of return of around 4 to 4.5 per cent as fair value. Of course, this depends on what happens with interest rates and inflation. If the Federal Reserve funds rate doubles over the next year, to maintain a fair ERP the required annualised returns from equities would be 5 to 5.5 per cent. Investors need to make a call on which markets look likely, based on current price levels and future expected cash flows, to achieve this.
Furthermore, as countries have differing risk profiles, we might add a country risk premium to each market to increase our required rate of return. One suggestion for developing countries might be to look at the spread on credit default swaps (CDSs) for their government debt versus the CDS on US 10-year Government bonds. Adding this to the required rate of return would help assess whether higher-risk markets are offering fair value.
Looking behind the volatility story to see where premiums could lie
Some of the research that has been carried out to investigate the low volatility story provides a clue where to flex asset allocation. Work by global index provider MSCI suggests that the low level of the VIX is down not to a collapse in the premium investors are demanding for volatility, but rather because realised volatility of the S&P 500 has been driven down by a decline in correlations between stocks.
To explain further we need to return to the concept that the VIX, as an implied volatility index, is a measure of uncertainty in the markets and the rate of change in compensation requirements. Realised volatility is a measure of the risks that have actually materialised. The MSCI study shows that, apart from times of serious market distress when realised volatility is exceptionally high, the VIX is often higher. Examining this relationship, MSCI found the premium has not shrunk, but that lower realised volatility has had the effect of reducing the absolute level the VIX must be at to maintain it.
The reason given by MSCI for lower index volatility is the breakdown in stock correlations, with the average pairwise correlation between US stocks at a very low level of 0.15 in 2017. If stocks are behaving differently to one another then this is an opportunity for investors and could signal that it is time to adopt a different approach to the S&P 500.
The massive trend for investing in the US index passively via ETFs has ratcheted up the price of the largest US stocks by market capitalisation. Lower correlation between the mega-caps and other stocks hints at value opportunities in smaller, less popular companies. Investors who are wary of US fund managers’ often reported failure to beat the S&P 500 could also play value passively, with a low-cost value factor ETF.
MSCI also looked at the volatility premium for global equity markets as a whole and found that it hasn’t declined, indicating that stock correlations are more likely to be the root cause of lower global volatility. This suggests there is alpha to be had in markets like the UK and Europe. In these markets, fund managers have a better record of beating benchmarks and now, even though the FTSE 100 is at record highs, if stock correlations are falling in the UK then skilful stock-pickers will surely sniff out opportunities, especially further down the market cap scale.
The role of volatility in portfolio risk management
To reiterate, the volatility trends and indicators we have discussed are short-term measures of sentiment and recently realised market behaviour. The distinction needs to be made with the way longer-term volatility is used to express risk in portfolio management. In modern portfolio theory (MPT) the amount that a security price has moved or the fluctuation in total returns is taken to represent how much risk the investor has borne, or is taking on.
Measured by the standard deviation of long-run returns, volatility demonstrates how valuations have been affected by good and bad news. Observed falls in prices are the embodiment of true risks that have materialised and although conventional statistical modelling has inadequacies in reflecting the probability of the worst market falls, it does at least give an indication of which assets and markets are riskiest. This is worth remembering when flexing portfolios in reaction to curiosities in the implied volatility factor shown by indices like the VIX or, indeed, any other return factor.
What would bring back short-term volatility?
The price the market is at and the expected growth rate in company earnings and dividend payouts implies the rate of return participants demand for accepting the risk. Volatility will return if investors rapidly start to reassess their requirements. If company earnings disappoint then stock prices will drop to demonstrate that a lower entry point is required for new buyers to make their required return based on the reassessment of future cash flows on offer.
Also, as discussed, for a worthwhile equity premium to be maintained the implied future rate of return has to be high enough above the available yield on risk-free assets. If interest rates rise and the yield on cash and bonds improves, equities will need to become cheaper to attract investors.
Whether there is some existential event or a panicked realisation that cash flows don’t justify valuations, volatility will surely return to stock markets at some point, and when it does the effect will be to increase the implied risk premiums on offer for shares. One of the many quotes attributed to Warren Buffett is “to be bold when others are fearful”; that doesn’t mean to dive in and buy indiscriminately when markets are in turmoil, but that investors should keep in mind that there will be good companies that discount reward-to-risk when the market does next fall. Mr. Buffett may even get to rectify one of his rare mistakes: not buying Alphabet (US:GOOGL).
In essence, what really matters is to have a clear understanding of your own reward and risk requirements, and to select asset allocation and investments accordingly. Implied volatility and whether other people are fearful mainly matters as an indicator of when and where opportunities to pursue those goals exist. Investing will always carry risks, but these need to be accepted. The focus should be on mitigation rather than avoidance and achieving an optimal reward. Excitingly for active UK investors, the best way to achieve that end at the moment looks like through being a good stock-picker.


