While two months is certainly not an adequate period over which to judge performance, the ten stock portfolio from July has so far done pretty well with an average total return of 5.5 per cent to 11 September. That compares with 1.6 per cent from the MSCI World index and a negative 2.1 per cent from the FTSE All Share.
July's 10 Investment Trusts
| Trust | TIDM | Total Return (20 Jul 2020 - 11 Sep 2020) |
| TR European Growth | TRG | 12.1% |
| Baillie Gifford US Grth | USA | 11.6% |
| JPMorgan European Small Cos | JESC | 10.1% |
| Fidelity China Spec Sits | FCSS | 5.5% |
| Jupiter US Smaller Cos | JUS | 4.2% |
| European Assets | EAT | 3.7% |
| AVI Global Trust | AGT | 3.4% |
| Henderson European Focus | HEFT | 3.0% |
| JPMorgan US Small Cos | JUSC | 2.8% |
| Henderson Eurotrust | HNE | -1.5% |
| Average | - | 5.5% |
| S&P Global 1200 | - | 1.8% |
| FTSE All Share | - | -2.1% |
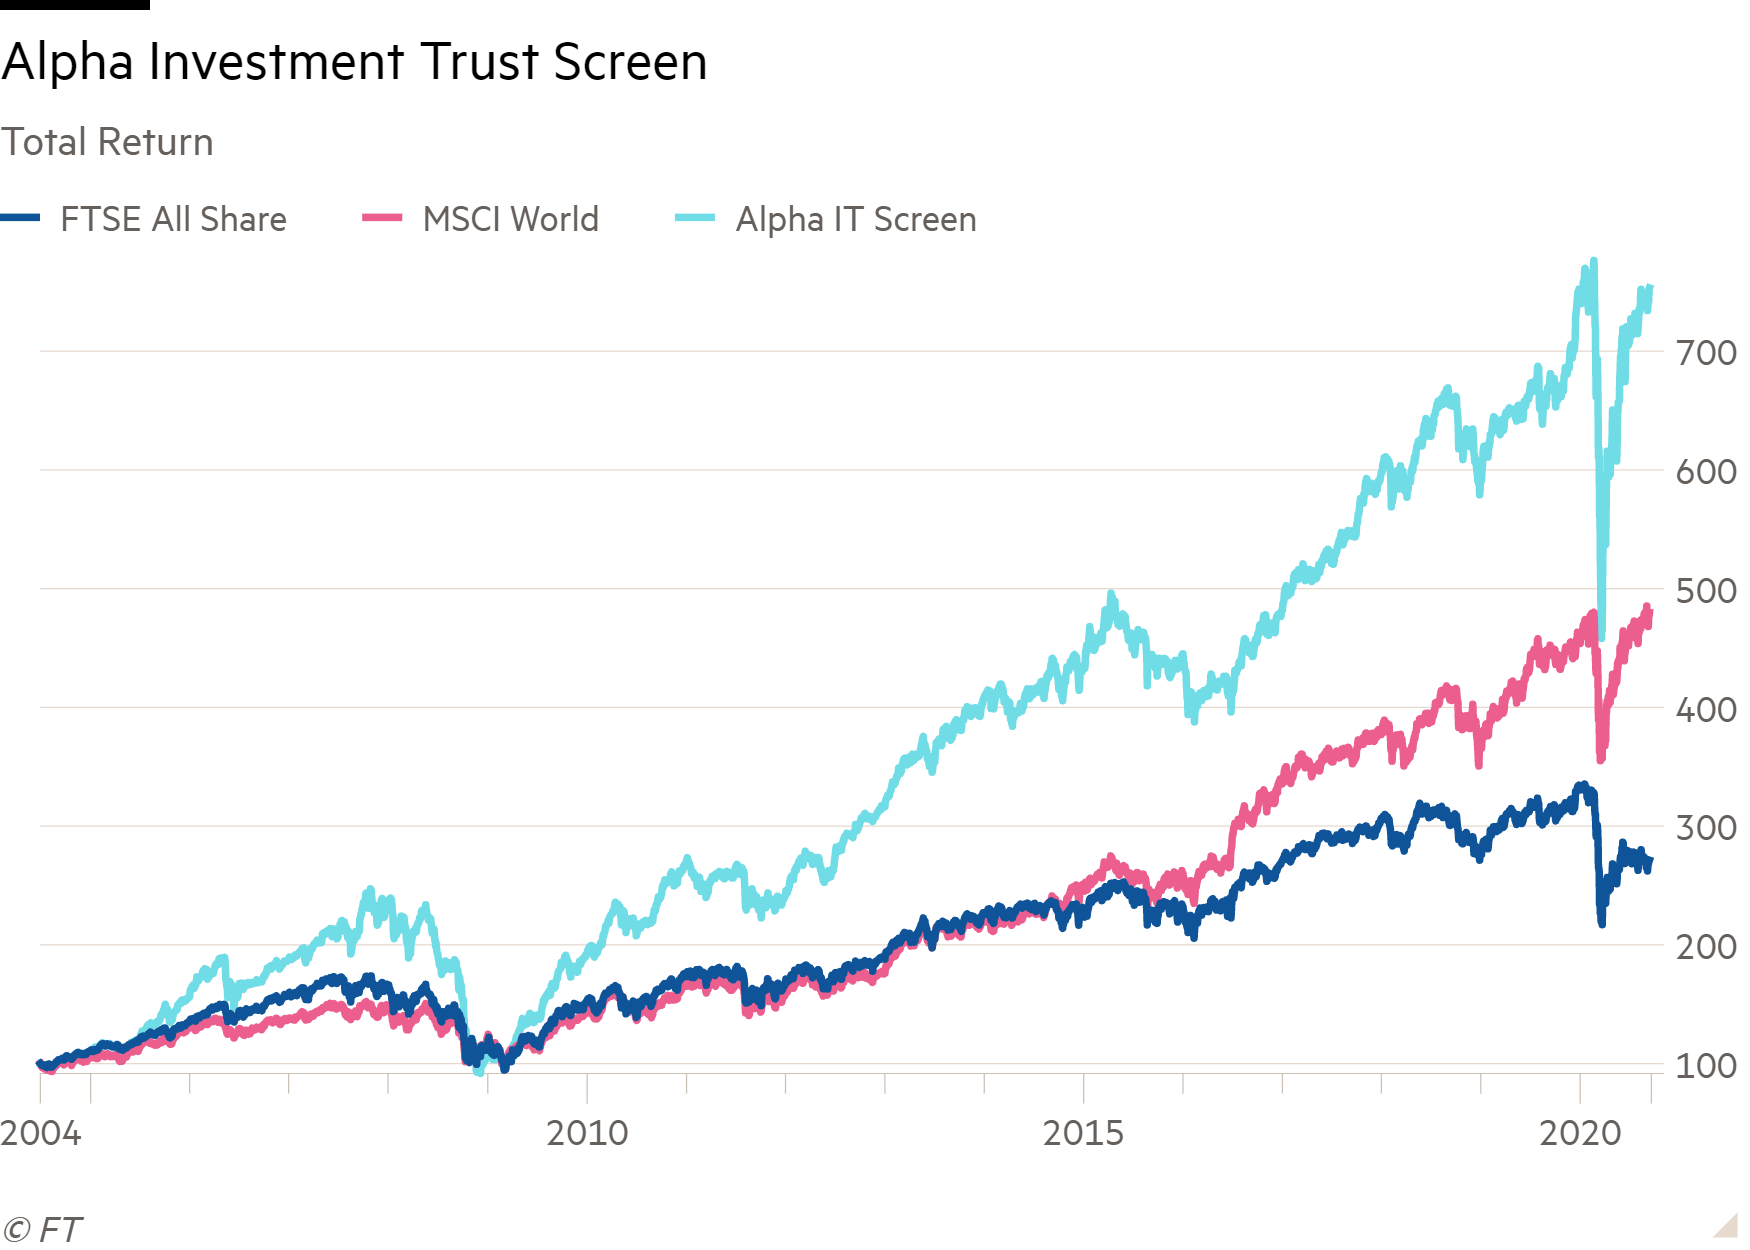
Fortunately, the investment trust selection process that this report uses to highlight ideas has a far longer back-tested track record than two months. Based on annual reshuffles and starting from mid-2004, the report’s ten-stock screening process boasts a 653 per cent cumulative total return through to 11 September which compares with 380 per cent from the MSCI World index and 171 per cent from the FTSE All Share. These performance figures exclude any notional dealing costs.
Before digging into the themes and trusts in this month's ten-stock portfolio, a quick explanation of how the screen attempts to unearth interesting investment trust ideas.
Screening rules
To fairly compare investment trusts with different remits and capital structures, the screen assesses trusts’ value relative to their one-year average premium/discount. This is done using a standardised measure called the Z-score (the number of “standard deviations” the premium/discount is from the mean average). A Z-score can be considered to be pretty cheap at when it gets below -1 (the bottom 16 per cent of the range) and extremely cheap at or below -2 (the bottom 2.5 per cent).
Three-month share price momentum is used as an indicator of sentiment towards trusts and their recent investment success. Our tables show the top 25 investment trusts based on a combined ranking of Z-score and momentum while the 10 stock portfolio, which is what this report focuses on, represents the highest ranking trusts that meet the following portfolio rules:
* Market capitalisation must be more than £100m.
* No tracker or hedge funds.
* No more than half the portfolio (five out of 10 shares) should have “niche” themes, and no more than two trusts should have the same niche. Trusts defined as niche are those focused on non-mainstream asset classes or sub-sectors such as private equity, debt, technology and biotechnology, and those focused on single countries (excluding the UK and US) or high-risk economic regions such as emerging markets. I also regard Asian smaller companies trusts as niche, but not Asian generalists.
* No more than half the portfolio (five out of 10 shares) should be mainstream trusts of the same type. This rule does not apply to global funds, but it does to other mainstream themes such as trusts investing in the UK (large and small companies), Europe, the US or Asia.
* All trusts must trade at a discount to NAV.
Here are the top 25 trusts:
| Discount to NAV | Share Price Performance | |||||||||||||||
| Rank | Name | TIDM | Market Cap | Price | DY | Z Score | Now | Avg | Low | High | 1m | 3m | 6m | 1y | 3y | 5y |
| 1 | BlackRock World Mining | BRWM | £700m | 403p | 5.5% | -1.8 | -14.8% | -11.1% | -3.2% | -20.8% | -3.7% | 11.6% | 30.8% | 21.6% | 24.7% | 143.5% |
| 2 | JPM Emg Mkts | JMG | £1,253m | 1,050p | 1.4% | -1.9 | -11.2% | -8.0% | -3.8% | -15.7% | -0.2% | 9.5% | 17.1% | 6.6% | 31.8% | 119.4% |
| 3 | Fidelity Asian Values | FAS | £254m | 345p | 2.6% | -1.4 | -9.3% | -2.7% | 5.2% | -14.8% | 2.7% | 8.5% | 2.4% | -19.8% | -4.4% | 72.8% |
| 4 | Herald | HRI | £1,044m | 1,572p | - | -1.2 | -18.1% | -14.5% | -5.3% | -28.8% | -6.4% | 10.2% | 28.6% | 19.6% | 40.5% | 124.3% |
| 5 | European Assets | EAT | £367m | 102p | 6.9% | -1.9 | -13.7% | -9.1% | -4.7% | -23.5% | -1.5% | 5.8% | 14.2% | 4.6% | -6.0% | 30.8% |
| 6 | JPM Indian | JII | £446m | 569p | - | -1.1 | -17.7% | -12.7% | -5.7% | -25.6% | 1.3% | 9.9% | -4.2% | -19.3% | -23.1% | 17.9% |
| 7 | Aberdeen Emerging Markets | AEMC | £253m | 550p | 4.0% | -1.8 | -18.4% | -14.8% | -10.8% | -19.1% | 0.5% | 5.8% | 2.8% | -1.4% | 0.6% | 62.8% |
| 8 | Asia Dragon | DGN | £521m | 412p | 1.2% | -1.5 | -14.2% | -11.6% | -5.1% | -19.8% | 2.0% | 6.5% | 10.3% | 2.2% | 18.9% | 89.8% |
| 9 | Genesis Emg Mkts | GSS | £896m | 738p | 2.0% | -1.8 | -14.9% | -11.6% | -7.6% | -18.5% | -0.4% | 4.4% | 9.2% | -3.1% | 13.9% | 78.8% |
| 10 | Schroder Asian Total Return | ATR | £395m | 404p | 1.6% | -0.7 | -1.8% | 0.2% | 5.6% | -16.3% | 4.1% | 14.1% | 24.9% | 12.3% | 27.1% | 139.1% |
| 11 | Scottish Mortgage | SMT | £13,518m | 923p | 0.4% | -0.6 | -2.7% | -1.1% | 7.6% | -16.5% | 5.0% | 23.7% | 66.0% | 81.2% | 118.5% | 287.9% |
| 12 | Aberdeen New India | ANII | £249m | 425p | - | -0.7 | -16.9% | -15.1% | -9.7% | -25.3% | 3.9% | 11.8% | 5.2% | -9.1% | -8.0% | 41.2% |
| 13 | Pacific Assets | PAC | £306m | 253p | 1.2% | -1.9 | -13.7% | -5.6% | 2.5% | -15.4% | -3.1% | 2.9% | 4.6% | -12.3% | 4.0% | 45.9% |
| 14 | JPM Global Emg Mkts Income # | JEMI | £342m | 115p | 4.4% | -1.2 | -10.8% | -6.5% | 2.2% | -18.5% | -0.9% | 5.0% | 2.2% | -11.4% | 0.2% | 53.3% |
| 15 | SME Credit Realisation Fund | SCRF | £120m | 56p | 9.4% | -0.6 | -32.4% | -23.2% | -4.1% | -46.4% | 1.6% | 11.6% | -23.8% | -17.3% | -25.4% | - |
| 16 | TR European Growth | TRG | £493m | 983p | 2.3% | -0.4 | -15.8% | -14.5% | -6.0% | -22.1% | 6.9% | 15.9% | 26.8% | 20.1% | -13.5% | 79.2% |
| 17 | Henderson European Focus | HEFT | £277m | 1,298p | 2.4% | -0.8 | -11.4% | -9.8% | -3.3% | -16.0% | 6.4% | 8.1% | 18.5% | 6.0% | 1.0% | 40.6% |
| 18 | Starwood Euro Real Estate Fin. | SWEF | £345m | 84p | 7.8% | -1.0 | -18.6% | -9.2% | 1.7% | -37.8% | -1.7% | 5.8% | -13.5% | -12.2% | -7.3% | 10.3% |
| 19 | Empiric Student Property | ESP | £410m | 68p | - | -0.7 | -33.7% | -22.1% | 1.2% | -47.8% | 8.5% | 8.6% | -22.4% | -24.9% | -31.5% | -20.6% |
| 19 | JPM Smaller Cos | JMI | £198m | 254p | 2.2% | -0.4 | -11.6% | -9.8% | 0.4% | -27.6% | 5.0% | 13.9% | 10.0% | 16.3% | 39.7% | 59.1% |
| 21 | Invesco Enhanced Inc | IPE | £118m | 68p | 7.4% | -0.9 | -7.2% | -1.8% | 5.1% | -28.4% | 1.0% | 5.9% | -6.4% | -1.3% | 3.3% | 35.3% |
| 22 | JPM European - Growth | JETG | £206m | 278p | 1.9% | -1.3 | -19.1% | -16.4% | -12.9% | -27.0% | 1.1% | 3.4% | 18.8% | -2.3% | -2.4% | 34.6% |
| 23 | AVI Global Trust | AGT | £774m | 729p | 2.8% | -0.9 | -12.3% | -10.7% | -6.3% | -15.6% | 2.4% | 5.5% | 13.9% | -1.0% | 11.2% | 76.9% |
| 24 | JPM Euro Smaller Cos | JESC | £643m | 403p | 1.7% | -0.2 | -14.2% | -13.7% | -9.5% | -24.1% | 6.9% | 17.8% | 26.9% | 14.1% | 9.7% | 74.8% |
| 25 | Aberdeen New Dawn | ABD | £288m | 263p | 1.6% | -0.5 | -13.4% | -12.4% | -7.8% | -20.2% | 3.4% | 10.3% | 13.6% | 5.9% | 19.6% | 94.1% |
And here’s the ten trust portfolio:
| Discount to NAV | Share Price Performance | |||||||||||||||
| Rank | Name | TIDM | Market Cap | Price | DY | Z Score | Now | Avg | Low | High | 1m | 3m | 6m | 1y | 3y | 5y |
| 1 | BlackRock World Mining | BRWM | £700m | 403p | 5.5% | -1.8 | -14.8% | -11.1% | -3.2% | -20.8% | -3.7% | 11.6% | 30.8% | 21.6% | 24.7% | 143.5% |
| 2 | JPM Emg Mkts | JMG | £1,253m | 1,050p | 1.4% | -1.9 | -11.2% | -8.0% | -3.8% | -15.7% | -0.2% | 9.5% | 17.1% | 6.6% | 31.8% | 119.4% |
| 3 | Fidelity Asian Values | FAS | £254m | 345p | 2.6% | -1.4 | -9.3% | -2.7% | 5.2% | -14.8% | 2.7% | 8.5% | 2.4% | -19.8% | -4.4% | 72.8% |
| 4 | Herald | HRI | £1,044m | 1,572p | - | -1.2 | -18.1% | -14.5% | -5.3% | -28.8% | -6.4% | 10.2% | 28.6% | 19.6% | 40.5% | 124.3% |
| 5 | European Assets | EAT | £367m | 102p | 6.9% | -1.9 | -13.7% | -9.1% | -4.7% | -23.5% | -1.5% | 5.8% | 14.2% | 4.6% | -6.0% | 30.8% |
| 6 | JPM Indian | JII | £446m | 569p | - | -1.1 | -17.7% | -12.7% | -5.7% | -25.6% | 1.3% | 9.9% | -4.2% | -19.3% | -23.1% | 17.9% |
| 8 | Asia Dragon | DGN | £521m | 412p | 1.2% | -1.5 | -14.2% | -11.6% | -5.1% | -19.8% | 2.0% | 6.5% | 10.3% | 2.2% | 18.9% | 89.8% |
| 10 | Schroder Asian Total Return | ATR | £395m | 404p | 1.6% | -0.7 | -1.8% | 0.2% | 5.6% | -16.3% | 4.1% | 14.1% | 24.9% | 12.3% | 27.1% | 139.1% |
| 11 | Scottish Mortgage | SMT | £13,518m | 923p | 0.4% | -0.6 | -2.7% | -1.1% | 7.6% | -16.5% | 5.0% | 23.7% | 66.0% | 81.2% | 118.5% | 287.9% |
| 13 | Pacific Assets | PAC | £306m | 253p | 1.2% | -1.9 | -13.7% | -5.6% | 2.5% | -15.4% | -3.1% | 2.9% | 4.6% | -12.3% | 4.0% | 45.9% |
Source: Winterflood Securities, 11 Sep 2020
So, what has this month’s screen highlighted?
The recently announced agreement between India and China to “disengage” their troops around the Himalayan border seems a fitting geopolitical backdrop for this month’s investment trust screen. While the screen, which seeks to identify trusts showing an advantageous blend of strong recent performance and relative value, has only highlighted one trust that is specifically focused on one of the two countries - JPMorgan Indian investment trust (JII) - the four Asian generalists among its picks - Fidelity Asian Values (FAS), Asia Dragon (DGN), Schroder Asian Total Return (ATR) and Pacific Assets (PAC) - all have significant exposure to the countries. And while classified in a different sector, JPMorgan Emerging Markets (JMG) is also a play on the theme with almost two fifths of its assets in China and a further 15 per cent in India.
The geographies are also important to some other screen picks which have less obvious connections. Growth in both countries, but especially China, is a key factor in assessing prospects for the investments of the screen’s top pick, Black Rock World Mining (BRWM). And even tech-heavy global generalist Scottish Mortgage (SMT) picks up on the theme with 17 per cent of its portfolio invested in innovative Chinese companies, including large positions in Alibaba (9988-HK) and Tencent (700-HK).
Macro machinations
From an investment perspective, the common thread between China and India is the potential for significant growth. However, more striking than the similarities between Asia’s two most-populous nations are their differences.
Indeed, the previously mentioned skirmishes in the Himalayas over the summer help highlight contrasting world views. The icy relationship China has with its biggest export customer, the US, compares with India’s relatively-friendly disposition to the West. Meanwhile China’s authoritarian politics and tight control of key economic players seems a world apart from India’s noisy democracy and unruly, localised and highly-bureaucratic systems.
For growth focused investors, China’s tale is of an established economic titan transitioning from rapid export led-growth to an economy focused more on consumption and innovation. India’s allure is meanwhile about the attraction of the untapped potential in a vast and very young population, which a reforming government is seeking to help unlock.
The two countries have also experienced vastly contrasting fortunes during the Covid-19 crisis. Globally, China was first hit by the virus, and when it did act, was very firm with containment measures. As far as the numbers can be trusted from China (i.e. not that much) it’s economy has also been swift to recover, too, with recent industrial and export data proving surprisingly strong.
China is also behind on its fiscal spending plans for the year which should provide a tailwind for the rest of 2020, although spending projects are likely to be less focused on the type of areas that tend to have the quickest economic impact, such as infrastructure. The world may also get more news of the country’s next five year plan in coming months with innovation and tech expected to be a major focus. Indeed, this is one of the battle lines that has formed in the US-China trade war.
Perennial fears about the indebtedness of Chinese companies continue to fester in the background, though. Still the country’s stock market has been a strong performer so far this year, benefiting especially from its large, racy internet plays. The importance of China in the region also means investor sentiment towards it also tends to impact on sentiment towards its neighbours.
India has had a much worse year than China. While death rates in India have not been as bad as the world’s worst hit countries, such as Brazil, the virus has still inflicted considerable pain with about 72,000 dead. Meanwhile, a short and sharp lockdown in March has only had limited effect in controlling the illness meaning many measures have had to remain in place to counter the spread. These countermeasures have delivered a major blow to the economy which experienced a 24 per cent drop in second quarter GDP.
There is also a concern that the disruption caused by the pandemic will rob impetus from the reform agenda of prime minister Narendra Modi, despite his enduring popularity and strengthened majority following re-election last year. Reforming zeal is currently focused on labour laws and social security. Concerns about the balance sheets of India’s state banks is also an issue, and with inflation running at 4 per cent, the government may find there are limits to the level of support it can offer.
Despite the challenges, the growth potential of India means its stock market can’t be described as cheap. Data compiled by Star Capital values the Indian market at 34 times earnings, 2.8 times sales and on a dividend yield of just 1.4 per cent. Indeed, despite falling hard during lockdown, the MSCI India index has rebounded to break even levels year to date. That said, from the perspective of this screen the near-term challenges for India mean those trusts with high exposure are themselves showing potential “value” based on wider-than-usual discounts.
Meanwhile, trusts with high exposure to China are catching the screen’s attention thanks to their strong recent performance. Actually, the key differentiator in performance terms is based on exposure to China’s racy internet businesses more than the market as a whole. These stocks have been a key driver of the MSCI China index’s 13.4 per cent gain in the year to date. That’s rather staggering against the backdrop of an increasingly bitter trade war with the US and a global pandemic which emerged from one of its cities.
In regards to Asia more generally, the region is increasingly seen as home to many good-quality, well-financed and capital-light companies; lots of them technology focused. This has underpinned investor enthusiasm as has the success of many companies in East Asia at controlling infections.
With these key themes in mind, let’s have a bit of a closer look at the screen’s picks. These write ups are not ordered based on screen ranking but rather are arranged by themes. I’ll start with the the six trusts with strong geographic exposure to Asia, toggling from the trust with the most India exposure to the one with the least, which effectively means toggling from trusts displaying the most potential “value” to those displaying strongest momentum.
Asia
JPMorgan India (JII)
| Name | TIDM | Market Cap | Price | DY | |
| JPM Indian | JII | £446m | 569p | - | |
| Discount to NAV | |||||
| Z Score | Now | Avg | Low | High | |
| -1.1 | -17.7% | -12.7% | -5.7% | -25.6% | |
| Share Price Performance | |||||
| 1m | 3m | 6m | 1y | 3y | 5y |
| 1.3% | 9.9% | -4.2% | -19.3% | -23.1% | 17.9% |
| Top Ten Holdings | |
| Name | % Portfolio |
| Tata Consultancy Services Ltd Ord | 10.1 |
| Infosys (Infosys Tech) Ltd Ord | 9.7 |
| Housing Development Fin (Hdfc) Ord | 8.8 |
| Reliance Industries Ltd Ord | 8.5 |
| Hdfc Bank Ltd Ord | 7.0 |
| Maruti Suzuki India (Mar Udyog) Ord | 6.0 |
| Itc Ltd Ord | 4.9 |
| Ultratech Cement Ltd Ord | 4.1 |
| Kotak Mahindra Bank Ltd Ord | 3.9 |
| Axis Bank Ltd Ord | 3.8 |
source: Winterflood Securities/Factset/Morningstar
JPMorgan Indian investment trust’s (JII) performance record not only bears the scars of a nasty hit from the Covid-crisis but also the poor positioning of the portfolio for a number of years prior. Indeed, at the start of 2020, having underperformed its benchmark by over 15 per cent in the three years to the end of September 2019, the company had to offer shareholders the chance to tender up to a quarter of their shares.
The pressure from shareholders to pep-up performance remains, given activist investor City of London has been the trust's largest shareholder for some time and currently has a 19 per cent stake.
The trust’s performance did improve a bit last year as a result of it giving up hopes for a near-term economic recovery and cutting exposure to cyclicals. However, it still went into the Covid melt-down with significant exposure to India’s big private banks which have been pummelled given the potential for rising bad loans.
The trust also suffered relative to the index during the sell off because of not holding shares in Hindustan Unilever, which has put in a relatively strong performance during the crisis and represents a major constituent in the MSCI India index. That said, the trust has used market weakness to start building a small position.
Despite the torrid run, there is reason to hope the trust may reinvigorate performance. One of its two long-term joint managers, Rurkshad Stroff, has just retired and will be replaced by a highly-experienced colleague, Ayaz Ebranim. While the change has not been billed as of major significance, having some fresh managerial input could help get the portfolio out of its rut, especially as the presence of an activist is likely to encourage a deeper consideration of the need for change. What’s more, since Mr Ebranim took charge of another JPMorgan trust in 2016, JPMorgan Asian Growth & Income trust, it has produced stand-out returns, benefiting from a strong focus on China, as well as tech and consumer growth trends.
So while the discount of JPMorgan Indian shares does reflect the poor track record and troubled outlook, there is also a noteworthy opportunity to improve the rating with tangible positive developments.
Pacific Assets (PAC)
| Name | TIDM | Market Cap | Price | DY | |
| Pacific Assets | PAC | £306m | 253p | 1.2% | |
| Discount to NAV | |||||
| Z Score | Now | Avg | Low | High | |
| -1.9 | -13.7% | -5.6% | 2.5% | -15.4% | |
| Share Price Performance | |||||
| 1m | 3m | 6m | 1y | 3y | 5y |
| -3.1% | 2.9% | 4.6% | -12.3% | 4.0% | 45.9% |
| Top Ten Holdings | |
| Name | % Portfolio |
| Cash/Short-Term Investments | 10.5 |
| Tech Mahindra Ltd Ord | 5.7 |
| Unicharm Corp Ord | 5.7 |
| Vitasoy International Holdings Ord | 4.0 |
| Hoya Corp Ord | 3.6 |
| Mahindra & Mahindra Ltd Ord | 3.5 |
| Nippon Paint Holdings Co Ltd Ord | 3.2 |
| Marico Ltd Ord | 3.2 |
| Delta Electronics Inc Ord | 3.0 |
| Tube Investments Of India Ltd Ord | 2.8 |
| Top Five Geog | % Portfolio |
| India | 32 |
| Taiwan | 17 |
| Japan | 14 |
| Hong Kong | 7.2 |
| Indonesia | 6.8 |
source: Winterflood Securities/Factset/Morningstar
Pacific Assets is a trust that has a long history as a sustainable investor, or to use the investment world’s current favourite acronym, ESG (Environmental Social and Governance). Despite the boom in this area over recent years, the trust’s recent performance has been pretty poor. Indeed, in part this can actually be put down to the trust’s requirement for good governance and corporate structure, which has contributed in the past to its steering clear of racy Chinese internet stocks. While the trust has said its assessment of this area remains an “ongoing process” and that it is interested in the potential for the cloud computing in Asia, it shows few signs of jumping on this key regional momentum play. Recent tech wobbles may yet prove the stance right, but the historically wide discount suggests investors do not want to bet on it.
Chinese companies on the whole are not known for their transparency or governance standards and the trust, which allocates money based on the merits of individual stocks rather than geographic considerations, has low exposure to the region overall. Instead the portfolio shows a preference for the more-troubled Indian market. That said, some positions were initiated in Chinese companies during the sell-off.
As well as focusing on sustainability and quality of management, the trust’s manager has a leaning towards companies with strong balance sheets. Unfortunately, this did little to protect performance during the Covid sell-off. Still, as more certainty creeps into the outlook and markets become more discriminating in sorting winners from losers, this focus may help.
The trust had also started to reduce exposure to financials prior to the pandemic due to the long-term outlook for interest rates, with Covid making the outlook for this sector all the more challenging. The trust offers some noteworthy exposure to Japan (see table), which has recently been favoured by investment legend Warren Buffett. The country’s stock market offers investors the combination of value and improving corporate governance standards.
However, the most noteworthy attraction Pacific Assets probably boasts is its ESG focus and the potential for this to have a more positive influence on future performance.
Fidelity Asian Values (FAS)
| Name | TIDM | Market Cap | Price | DY | |
| Fidelity Asian Values | FAS | £254m | 345p | 2.6% | |
| Discount to NAV | |||||
| Z Score | Now | Avg | Low | High | |
| -1.4 | -9.3% | -2.7% | 5.2% | -14.8% | |
| Share Price Performance | |||||
| 1m | 3m | 6m | 1y | 3y | 5y |
| 2.7% | 8.5% | 2.4% | -19.8% | -4.4% | 72.8% |
| Top Ten Holdings | |
| Name | % Portfolio |
| Cash/Short-Term Investments | 8.5 |
| Equity Other | 3.2 |
| Granules India Ltd Ord | 3.2 |
| Redington India Ltd Ord | 2.5 |
| Power Grid Corp Of India Ltd Ord | 2.4 |
| Taiwan Semiconductor Mfg Co Ltd Ord | 1.9 |
| Fufeng Group Ltd Ord | 1.7 |
| Derivative Securities (Other) | 1.6 |
| Axis Bank Ltd Ord | 1.5 |
| Convenience Retail Asia Ltd Ord | 1.4 |
| Top Five Geog | % Portfolio |
| India | 21 |
| China | 20 |
| South Korea | 10 |
| Hong Kong | 9.1 |
| Taiwan | 8.4 |
source: Winterflood Securities/Factset/Morningstar
While Fidelity Asian Values has slightly more exposure to China than Pacific Assets (see above), it also scores poorly for its exposure to what has recently proved the most exciting part of the Chinese market - internet stocks. That’s contributed to a tough year for the trust so far and a wide discount by historical standards.
The fund’s investment style is focused on two areas that are currently out of favour: “value” and small caps. The small cap focus was underlined at the beginning of the year when the trust’s benchmark was changed to the MSCI All Countries Asia ex-Japan Small Cap index from the main version of the index. The investment approach has led to a very poor run compounded further by the trust being relatively overweight in the highly-cyclical financial sector.
The trust has sold companies which it views as not being financially strong enough to weather the Covid-crisis while also attempting to pick up oversold shares. However, what would be of most benefit is a change of market sentiment away from the current big-growth-or-bust mantra. Ironically, early on in most market recoveries small cap value stocks tend to make strong gains, however, there are few signs yet of this familiar trend emerging.
In March, the trust used buyback to bring the discount back in from a decade high of about 15 per cent. With the discount still relatively wide buybacks may continue to be used to support the valuation.
JPMorgan Emerging Markets (JMG)
| Name | TIDM | Market Cap | Price | DY | |
| JPM Emg Mkts | JMG | £1,253m | 1,050p | 1.4% | |
| Discount to NAV | |||||
| Z Score | Now | Avg | Low | High | |
| -1.9 | -11.2% | -8.0% | -3.8% | -15.7% | |
| Share Price Performance | |||||
| 1m | 3m | 6m | 1y | 3y | 5y |
| -0.2% | 9.5% | 17.1% | 6.6% | 31.8% | 119.4% |
| Top Ten Holdings | |
| Name | % Portfolio |
| Taiwan Semiconductor Mfg Co Ltd Adr | 9.3 |
| Tencent Holdings Ltd Ord | 8.1 |
| Alibaba Group Holding Ltd Spons Adr | 7.5 |
| Epam Systems Inc Com | 6.0 |
| Housing Development Fin (Hdfc) Ord | 4.3 |
| Aia Group Ltd Ord | 4.3 |
| Mercadolibre Inc Com | 3.5 |
| Tata Consultancy Services Ltd Ord | 3.5 |
| Ping An Insurance Group China Ord H | 3.2 |
| Sea Ltd /Sg/ Sponsored Adr | 2.7 |
| Top Five Geog | % Portfolio |
| China | 30.2 |
| India | 15.3 |
| Taiwan | 12.1 |
| Brazil | 8.9 |
| Hong Kong | 8.6 |
source: Winterflood Securities/Factset/Morningstar
Austin Forey, the highly-respected long-term manager of the JPMorgan Emerging Markets investment trust may well regard recent market ructions as vindication of his well-established investment approach. The trust aims to hold high-quality, financially strong companies for long periods of time. This meant the trust sat tight during the Covid sell off before the portfolio surged back with the help of its considerable exposure to Chinese tech plays.
The high exposure to tech reflects the trust's enthusiasm for capital-light companies. Not all the trust's bets have done so well. There is noteworthy exposure to some of the Indian banks which made the Covid sell-off so painful for some of the other trusts with high exposure to the country (see above). However, these holdings provide exposure to the long-term growth potential of the Indian economy which means the trust has been happy to endure the pain for now.
Recent tech wobbles and general nervousness about the potential popping of a “growth bubble” may have contributed to a recent widening of the discount. The trust does have a commitment to using buybacks to keep the discount in check, and based on past form, the discount may be set to benefit from such intervention.
Asia Dragon (DGN)
| Name | TIDM | Market Cap | Price | DY | |
| Asia Dragon | DGN | £521m | 412p | 1.2% | |
| Discount to NAV | |||||
| Z Score | Now | Avg | Low | High | |
| -1.5 | -14.2% | -11.6% | -5.1% | -19.8% | |
| Share Price Performance | |||||
| 1m | 3m | 6m | 1y | 3y | 5y |
| 2.0% | 6.5% | 10.3% | 2.2% | 18.9% | 89.8% |
| Top Ten Holdings | |
| Name | % Portfolio |
| Tencent Holdings Ltd Ord | 10 |
| Taiwan Semiconductor Mfg Co Ltd Ord | 9.2 |
| Samsung Electronics Ord Pfd Nvtg | 9.1 |
| Ping An Insurance Group China Ord H | 3.0 |
| Kweichow Moutai Co Ltd Ord A | 2.9 |
| Aia Group Ltd Ord | 2.8 |
| Pt Bank Central Asia Ord | 2.7 |
| China Resources Land Ltd Ord | 2.6 |
| Housing Development Fin (Hdfc) Ord | 2.3 |
| Wuxi Biologics Cayman Inc Ord | 2.2 |
| Top Five Geog | % Portfolio |
| China | 41 |
| India | 11 |
| Taiwan | 11 |
| South Korea | 11 |
| Hong Kong | 7.0 |
source: Winterflood Securities/Factset/Morningstar
The likes of Fidelity Asian Values and Pacific Assets (see above) may well have looked on with envy at the performance of Asia Dragon over the last year. That’s because this tech and China focused trust not so long ago looked a lot more like them.
After three years of portfolio overhaul, the trust underlined the changes made by last year renaming itself. It had previously been called Edinburgh Dragon. The old name had associations with its former management - it is now managed by a team at Aberdeen Standard - and its value investment style. That value focus had previously led the trust to shun Asia’s big tech names while governance concerns also meant China was given a wide berth.
Tech and China now reflect the biggest portfolio bets at 26 per cent and 41 per cent, respectively. And while India is the second largest country bet, the proportion of assets here is down considerably from three years ago.
Whether the shares will re-rate depends on whether the trends the trust has so firmly latched itself to persist; an issue that’s presently preoccupying many investors. But while it is still relatively early days following the sharp change of tack, so far things have gone pretty well.
Schroder Asian Total Returns (ATR)
| Name | TIDM | Market Cap | Price | DY | |
| Schroder Asian Total Return | ATR | £395m | 404p | 1.6% | |
| Discount to NAV | |||||
| Z Score | Now | Avg | Low | High | |
| -0.7 | -1.8% | 0.2% | 5.6% | -16.3% | |
| Share Price Performance | |||||
| 1m | 3m | 6m | 1y | 3y | 5y |
| 4.1% | 14.1% | 24.9% | 12.3% | 27.1% | 139.1% |
| Top Ten Holdings | |
| Name | % Portfolio |
| Taiwan Semiconductor Mfg Co Ltd Ord | 7.4 |
| Alibaba Group Holding Ltd Spons Adr | 6.4 |
| Samsung Electronics Co Ltd Ord | 6.3 |
| Tencent Holdings Ltd Ord | 6.1 |
| Techtronic Industries Co Ltd Ord | 3.9 |
| Aia Group Ltd Ord | 2.8 |
| Galaxy Entertainment Group Ltd Ord | 2.7 |
| Bhp Group (Billiton) Ltd Ord | 2.6 |
| Wuxi Biologics Cayman Inc Ord | 2.4 |
| Sea Ltd /Sg/ Sponsored Adr | 2.2 |
| Top Five Geog | % Portfolio |
| China | 26 |
| Hong Kong | 23 |
| Taiwan | 17 |
| Australia | 11 |
| South Korea | 9.0 |
source: Winterflood Securities/Factset/Morningstar
In terms of the current preoccupation with whether there will be a turn in sentiment away from the dominant big tech trend, Schroder Asian Total Returns is a trust that dares have a view. Having ridden the stratospheric rise in the share prices of big Chinese internet companies, at its recent half year results it warned valuations in some parts of the market were steep.
Specifically, the trust is looking to become more defensive due to concern about frothy sectors which could be badly hit if performance disappoints. It has particularly highlighted internet, technology and healthcare-related areas. The trust has said it may also buy protection against falls if the market rally continues.
More broadly, though, Schroder Asian Total Returns continues to have faith in its focus on quality companies with strong balance sheets. Indeed, this has served shareholders well over the long-term which is reflected in the fact that despite the shares trading at a “cheap” level compared with the historical range, the discount itself is puny.
Tech
Technology is a clear theme that distinguishes many of the best performing Asian trusts already looked at. A key reason why these trusts may be relatively cheap compared with the last year is the recent tech wobble. This has involved the US tech index, Nasdaq, falling by over 10 per cent since the start of the month. The rally that preceded the fall was exceptional, too, and a build up in speculative option trading has been cited by many as a key reason for the volatility. Indeed, heavy options trading by Japanese tech investor SoftBank, dubbed the Nasdaq Whale, has been reported as a significant factor as well as Robinhood (a US no-fee online broker) day traders.
The gyrations have once again raised the tempo on the debate about whether a bubble has formed in growth stocks and particularly tech. At such times, tech focused trusts have a habit of moving to a wider-than-usual discount to reflect the increased nervousness. That makes their shares interesting to this screen, which is always eager to go against sentiment if three-month momentum remains strong enough.
At some point, this strategy is likely to prove disastrous, but from following this screen I’ve been able to observe that over a number of recent years it has proved very profitable. That said, there is no denying tech is expensive on conventional measures with the Nasdaq commanding a multiple of 36 times earnings and 3.8 times sales. That’s even more expensive than the Indian market (see above)! Although at least Nasdaq has a 2020 performance record to help justify the enthusiasm, with a 21 per cent gain in the year to date.
Scottish Mortgage (SMT)*
| Name | TIDM | Market Cap | Price | DY | |
| Scottish Mortgage | SMT | £13,518m | 923p | 0.4% | |
| Discount to NAV | |||||
| Z Score | Now | Avg | Low | High | |
| -0.6 | -2.7% | -1.1% | 7.6% | -16.5% | |
| Share Price Performance | |||||
| 1m | 3m | 6m | 1y | 3y | 5y |
| 5.0% | 23.7% | 66.0% | 81.2% | 118% | 288% |
| Top Ten Holdings | |
| Name | % Portfolio |
| Tesla Inc Com | 21 |
| Amazon Com Inc Com | 9.4 |
| Alibaba Group Holding Ltd Spons Adr | 5.8 |
| Tencent Holdings Ltd Ord | 5.6 |
| Illumina Inc Com | 5.0 |
| Asml Holding Nv Ord | 3.3 |
| Delivery Hero Se Ord | 2.7 |
| Kering Ord | 2.6 |
| Netflix Inc Com | 2.5 |
| Equity Other | 12 |
| Top Five Geog | % Portfolio |
| United States | 44 |
| China | 17 |
| Germany | 6.2 |
| Netherlands | 3.7 |
| France | 2.3 |
source: Winterflood Securities/Factset/Morningstar
Scottish Mortgage’s top holding, Tesla, is a stock that has become synonymous with the pandemic tech rally and recent correction. The Factset data used in the accompanying tables puts the trust’s Tesla stake at about a fifth of its portfolio following the shares’ astronomical run in 2020. However, at the time of the last portfolio disclosure the holding accounted for closer to 13 per cent. While a representative for the trust reckons Factset data may significantly overstate the importance of the holding, not least because of recent share sales. While the trust would not confirm what the actual holding is, a spokesperson did say, "Scottish Mortgage has portfolio diversification parameters in place, which are adhered to. In the past, this has given rise to trimming of larger holdings to ensure an appropriate level of portfolio diversification.” Given the extreme ups-and-downs in Tesla's share price, even the trust's next factsheet covering the period to the end of August (around the time of Tesla's 2020 peak to date) may fail to give that clear a picture.
For tech’s sceptics, the electric-car and battery company’s soaring share price, frequent need for fresh capital, aggressive accounting policies, and maverick founder, Elon Musk, all symbolise the market’s most dangerous excesses. However, for the investment trust, which has long been a staunch advocate of Tesla, the company is creating huge long-term value with a vision built on not only its cars but the software it is developing to make them drive themselves. All the same, the soaring value of Tesla’s shares has seen the trust trim it’s stake recently. Just as well, given the share price has fallen 25 per cent in this month’s sell-off.
Importantly, though, Scottish Mortgage’s long-term focus on major disruptive trends has proved hugely profitable for its shareholders over many years. It has also been able to use its clout to gain access to off-market investments where many of the most exciting tech opportunities have been in recent years. One of these investments, Chinese fintech Ant Financial, may be about to come to fruition with a $200bn IPO slated. Alibaba-owned Ant is the trust’s largest unlisted holding at about 2.5 per cent of net asset value (NAV).
No one is going to argue with Scottish Mortgage's record and the integrity of its managers, but the recent sell-off is a reminder of the risks of a high-conviction, highly-focused approach. Indeed, Morningstar recently downgraded the trust from “gold” to “silver” and broker Stifel suggested it was time to “lock in gains”.
*the writer owns shares in this trust
Herald Investment Trust (HRI)*
| Name | TIDM | Market Cap | Price | DY | |
| Herald | HRI | £1,044m | 1,572p | - | |
| Discount to NAV | |||||
| Z Score | Now | Avg | Low | High | |
| -1.2 | -18.1% | -14.5% | -5.3% | -28.8% | |
| Share Price Performance | |||||
| 1m | 3m | 6m | 1y | 3y | 5y |
| -6.4% | 10.2% | 28.6% | 19.6% | 40.5% | 124.3% |
| Top Ten Holdings | |
| Name | % Portfolio |
| Cash/Short-Term Investments | 7.8 |
| GB Group | 3.3 |
| Itm Power Plc Ord | 2.6 |
| Pegasystems Inc Com | 2.5 |
| Diploma Plc Ord | 2.4 |
| Batm Advanced Communications Ord | 2.4 |
| Yougov Plc Ord | 2 |
| Five9 Inc Com | 1.8 |
| Liveperson Inc Com | 1.6 |
| Descartes Systems Group Inc Com | 1.6 |
| Top Five Geog | % Portfolio |
| United Kingdom | 47 |
| United States | 24 |
| China | 3.1 |
| France | 2.5 |
| Canada | 2.3 |
source: Winterflood Securities/Factset/Morningstar
While Herald investment trust is billed as a global small cap technology investor, the large weighting it has towards the UK is a typical feature of the portfolio rather than representing an unusual fondness for the market. That’s not to say the trust’s veteran manager Katie Potts isn’t fond of the prospects for UK technology, she cut her teeth as a top UK tech analyst before launching Herald in 1994. What’s more, over the years she has done extremely well from focusing on homegrown tech plays, both as the manager of the trust and a major shareholder.
Herald’s share price has taken a big knock from the recent technology sell-off with the shares down 12 per cent this month. The noteworthy cash position carried by the trust at the time of its last portfolio update should provide some protection and also an opportunity to wade in should the tech turmoil deepen. The fact Herald has made it through the dot.com boom and bust and lived not only to tell the tale but also to handsomely reward long-term holders, should provide some reassurance.
*the writer owns shares in this trust
European Assets (EAT)
| Name | TIDM | Market Cap | Price | DY | |
| European Assets | EAT | £367m | 102p | 6.9% | |
| Discount to NAV | |||||
| Z Score | Now | Avg | Low | High | |
| -1.9 | -13.7% | -9.1% | -4.7% | -23.5% | |
| Share Price Performance | |||||
| 1m | 3m | 6m | 1y | 3y | 5y |
| -1.5% | 5.8% | 14.2% | 4.6% | -6.0% | 30.8% |
| Top Ten Holdings | |
| Name | % Portfolio |
| Gerresheimer Ag Ord Brr | 4.0 |
| Vidrala Sa Ord | 3.5 |
| Scout24 Ag Ord | 3.3 |
| Simcorp As Ord | 3.1 |
| Tecan Group Ag Ord Reg | 3.1 |
| Imcd Nv Ord | 3 |
| Royal Unibrew As Ord | 2.9 |
| Ringkjobing Landbobank As Ord | 2.9 |
| Wizz Air Holdings Plc Ord | 2.9 |
| Elekta Ab Ord B | 2.6 |
| Top Five Geog | % Portfolio |
| United Kingdom | 47 |
| United States | 24 |
| China | 3.1 |
| France | 2.5 |
| Canada | 2.3 |
source: Winterflood Securities/Factset/Morningstar
When I first ran this new Alpha investment trust report, Europe was the big theme. As I tapped at my keypad, the economic bloc was locked in negotiations about providing a grant-based recovery package funded by EU backed debt. The €750bn stimulus plan finally got the thumbs up early the following week representing a major step forward in creating a more coherent economic framework for the members of the currency union.
Three of the five European trusts highlighted by the screen were focused on smaller companies and these have gone on a bit of a tear since, except that is for European Assets. While European Asset’s 3.7 per cent total return since the previous screen was published is far better than an investor would have got tracking the FTSE All Share, it is poor against the runs from its rivals which are both up by more than 10 per cent (see table at the start of this report).
This feels rather a shame because the value focused trust had made some major changes to the portfolio during the pandemic sell-off to increase its focus more on quality and growth. There is still the potential for the moves to come good and sentiment towards Europe is certainly stronger thanks to the political progress recently made. Many commentators foresee further appreciation of the euro against the dollar and sterling.
A standout feature of the trust is the very high yield. However, weak support for the dividend payment from actual holdings means the only way to keep dishing out income to shareholders is likely to be from selling chunks of the portfolio. Arguably there is some merit to this when the discount is so wide, but investors should see the high yield in light of this and realise it is potentially a drain on long-term NAV performance.
BlackRock World Mining (BRWM)*
| Name | TIDM | Market Cap | Price | DY | |
| BlackRock World Mining | BRWM | £700m | 403p | 5.5% | |
| Discount to NAV | |||||
| Z Score | Now | Avg | Low | High | |
| -1.8 | -14.8% | -11.1% | -3.2% | -20.8% | |
| Share Price Performance | |||||
| 1m | 3m | 6m | 1y | 3y | 5y |
| -3.7% | 11.6% | 30.8% | 21.6% | 24.7% | 144% |
| Top Ten Holdings | |
| Name | % Portfolio |
| Rio Tinto Plc Ord | 10 |
| Bhp Group Plc Ord | 9.5 |
| Newmont Corp Com | 8.5 |
| Barrick Gold Corp Com | 6.9 |
| Agnico Eagle Mines Ltd Com | 5.1 |
| Wheaton Precious Metals Corp Com | 5.0 |
| Vale Sa Sponsored Adr | 4.8 |
| Franco Nevada Corp Com | 3.4 |
| Northern Star Resources Ltd Ord | 3.2 |
| Oz Minerals Ltd Ord | 2.8 |
source: Winterflood Securities/Factset/Morningstar
They say save the best for last, and the screen gives the BlackRock World Mining trust the distinction of being its top pick. The trust plays to a major economic theme that has been put front and centre by Covid; namely the impact of massive monetary and fiscal stimulus. There are many that believe the economic reaction to Covid-19 will ultimately cause inflation and possible debasement for some fiat currencies. This has led to a surge in the price of gold, which while itself a volatile asset, is commonly regarded as a hedge against inflation, dollar weakness and a plethora of other economic ills. The share prices of gold miners have amplified this move as miners’ large fixed-cost bases make their profits highly sensitive to the price of the yellow metal. BlackRock holds about a third of its portfolio in gold miners.
However, it is not only gold that may benefit from a more inflationary environment. Real assets, such as commodities, are generally considered likely beneficiaries. What’s more, the type of stimulus being proposed by major economies could be a significant benefit to certain commodities. The “build back greener” agenda should fuel demand for copper, which is needed for electrification, as well as the raw materials needed for batteries, such as cobalt and lithium. The BlackRock trust is playing these themes.
Should the demand story play out, relatively weak markets for many metals since the 2015 commodities crash means supply could struggle to keep up with a serious increase in demand spelling happy days for prices.
However, alongside these positive stories is the fact that commodities are cyclical and the world is still in the grips of a pandemic. How stimulus will work and when a recovery will set in are certainly not a given. Still, the screen is betting BlackRock World Mining is taking a pause for breath following its strong performance so far this year, rather than going into reverse.
*the writer owns shares in this trust
That’s the ten trust for this month. Hopefully readers will have found some interesting ideas and themes to ponder among the selection.
Download PDF