Last week’s Trader column focused on some commodities, which then led me to think about the so-called ‘commodity currencies’. Quite frankly, this is a flawed concept and one where analysts and pundits get their terminology all wrong – something I find terribly irritating and which destroys credibility. For example, the way they use the term ‘soft commodities’ interchangeably with agricultural commodities. Active softs are: cocoa, coffee, rubber, sugar and frozen concentrated orange juice (FCOJ); it also includes fruits, gur (a type of sugar), pepper and tea – only!
Countries whose economies are highly dependent on natural resources and agriculture are said to have these commodity currencies and are the Australian, Canadian and New Zealand dollars – only. Brazil, Malaysia, Ukraine et al don’t count. Silly, isn’t it? We’ll look at the technical outlook for these, to which we’ll add the Chinese yuan as China is the world’s biggest commodity importer.
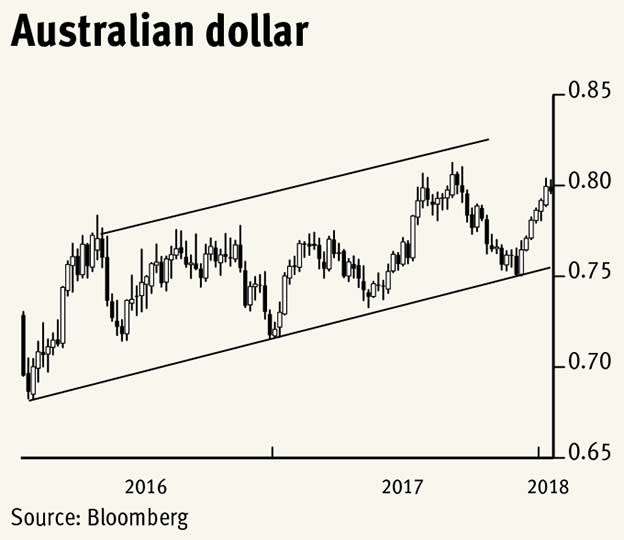
The Australian economy has seriously benefited from exports to mainland China, the last time they saw two consecutive quarters of negative GDP being Q1 and Q2 1991. Despite this the Aussie dollar is currently trading at about the mean of the past 30 years where one would have expected it to be stronger. Price action has been very subdued over the past two years and both observed and implied volatility are well over one standard deviation below the mean regression. For a currency that has swung between US50¢ (2001) to almost US110¢ (2011) per currency unit, optionality is certainly cheap now. Strengthening slowly since 2016’s low, we expect the neat channel to continue so that it gains over both its North American counterparts.
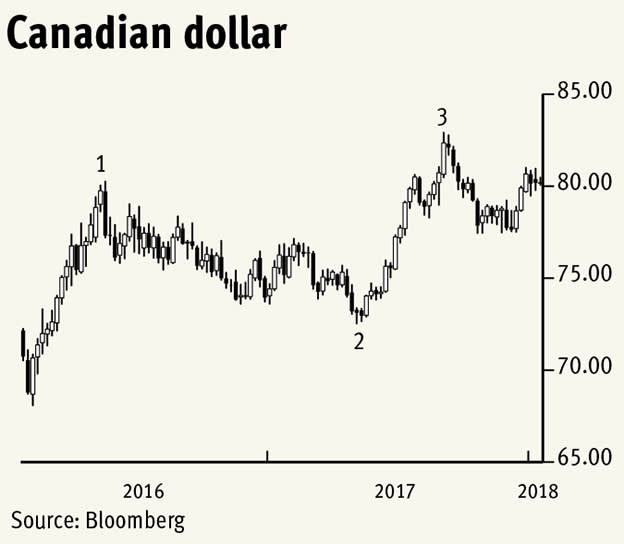
The Canadian dollar, also quoted as US cents per loonie over the Atlantic but not elsewhere (where it’s units of currency per greenback), has also got stronger since 2016 when it was close to its weakest ever, this despite the North American Free Trade Agreement (Nafta) potentially falling apart, which is interesting. The rather jagged three-step rally so far suggests that volatility will remain at or above its long-term mean. We expect the rally to continue towards US90¢.
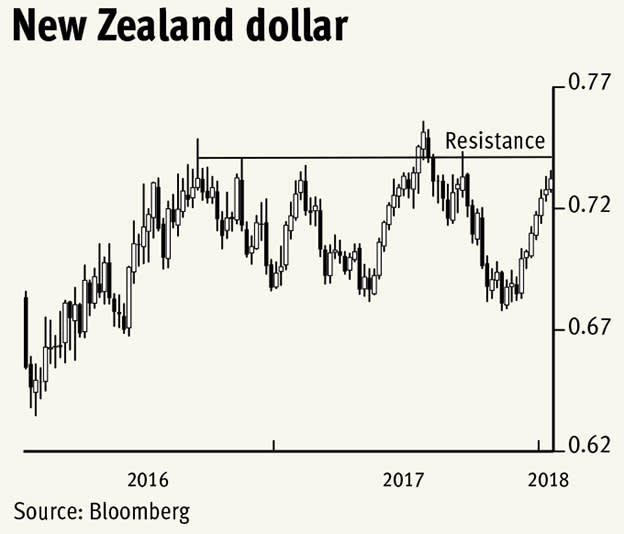
The kiwi, as New Zealand’s unit of account is affectionately known, has seen some fairly large swings over the past three years, reflected in volatility readings above our two previous examples. The chart looks to be setting up for a break above major long-term resistance around the 74¢ area. A sustained break above here is likely to catapult it up towards the record highs set in 2011 and 2014 around US88¢. However, there is a chance that it will underperform against its antipodean partner.
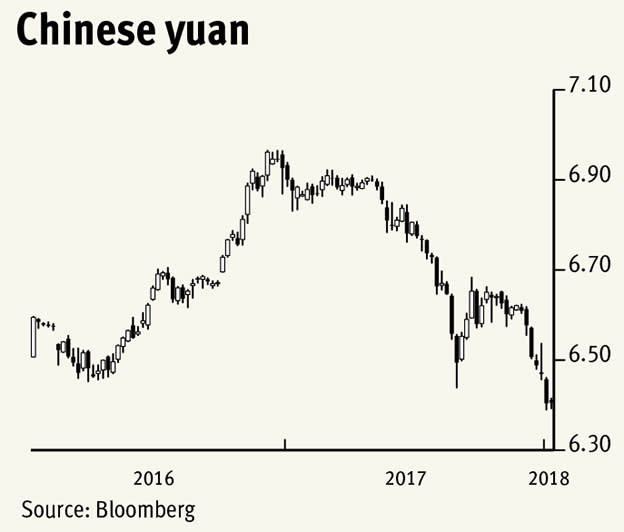
The Chinese yuan, globally priced as yuan per US dollar, has an onshore and an offshore version of itself, with a negligible difference between the two exchange rates. Described as a ‘managed float’ in polite society, President Trump has (unsurprisingly) stronger terms for what is achieved by the Peoples Bank of China (PBOC). It has appreciated from just over 8 yuan per dollar before the financial crisis, to just 6.05 in 2014 – and the ‘currency manipulator’ term still sticks. Since January last year it has strengthened from almost 7 yuan to 6.4 needed to buy a dollar today. We expect more generalised US dollar weakness this year, so that one needs just 6.1-6.2 yuan – a modest gain.