Some good leading indicators of equity returns point to the market recovering next year.
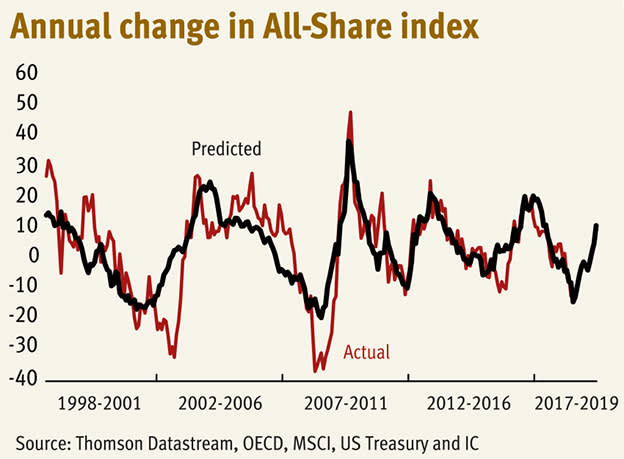
A handful of factors, taken together, have explained over half the variance in subsequent annual returns on the All-Share index since 1998. These lead indicators correctly predicted falling prices in 2000-01 and in 2008-09, and correctly predicted rises in 2004, 2009-10 and 2013. They are now pointing to the index rising just over 10 per cent by next December.
One reason for this is simply that the dividend yield is above its long-term average, suggesting the market is cheap. Controlling for other factors, which I’ll come to, a one standard deviation above average yield in the last 20 years has pointed to subsequent annual returns being four percentage points above average. The yield is now 1.9 standard deviations above average.
A second positive signal is that foreigners have been net sellers of US equities in the last 12 months. This is a sign that sentiment towards global equities has been unusually depressed recently, which in turn points to it mean-reverting upwards eventually. As it does so, global markets should rise, which should drag up the All-Share index.
These bullish indicators, however, are mitigated by two bearish ones.
One is that momentum is against the market. The All-Share index is now below its ten-month average. This has in the past sometimes led to deep bear markets.
The other is that the ratio of the money stock in developed economies to global share prices is still below average, albeit less so now than a few months ago. This is a sign that investors are overweight in equities and underweight in cash, relative to their usual positions, which points to a bigger risk of them trying to shift from equities to cash than vice versa.
Combining these signals into a simple statistical model points to the index rising just over 10 per cent over the next 12 months*. The model suggests most of the rise will come from the spring onwards, but that there is nevertheless around a one-in-six chance of the market falling in 2019.
My chart shows how this model has predicted returns in the past. Except for the market falling in 2002-03, and falling even more than expected in 2008-09, the performance has been okay. Better still, we have out-of-sample tests of this approach. These indicators correctly predicted a small rise in the market in 2017 and a fall this year.
You might object that all this is inconsistent with efficient market theory, which tells us that all information about future returns should be in the price and so we cannot use current data to predict future returns.
It is. This process is a guide to what might be in the price and what might not. A high dividend yield and foreign selling of US stocks, for example, suggest that investors are discounting more bad news than good. That means that if we get average news next year then there’s upside potential for the market.
But, you might think, we won’t get average news. Brexit is an obvious wild card.
I’m not sure how much this undermines this approach, though.
For one thing, equities in aggregate have so far been resilient to news about Brexit, partly because sterling acts as a shock absorber and partly because shares are globalised. A no-deal Brexit might well hurt domestically-oriented equities, but the fall in the pound it would cause would boost the overseas earnings of our largest companies, which comprise the majority of the All-Share index.
And for another, I don’t think there’s any way of predicting what will happen with Brexit: the noise-signal ratio is just too high. A pretence to knowledge is no substitute for actual knowledge.
Herein lies the issue. Most forecasts are stories, based upon the best judgment of the forecaster. Personally, I think these are silly: our judgment is prone to so many errors that it is unreliable – especially when our life savings are at stake. The question is: can a more disciplined and less judgement-based approach work? 2019 will at least give us one more data point here.
*Because we only have data on foreign buying of US equities and the OECD money stock for September, I’ve had to make some assumptions for the past of these two factors over the September-December period. I’m assuming a gentle rise in the OECD money stock, and that net foreign selling of US equities averages the same as it did in September ($16.9bn).