'Give me just a little more time' was a top 10 hit in 1970 for Detroit-based Motown band The Chairmen of the Board; it might be appropriate mood music at number 10 Downing Street this week. I cannot say I am eagerly or anxiously awaiting the next instalment of Westminster’s drama. Like many I speak to, I’m tired and fed up.
But it did set me thinking about how very important timing is to the serious investor. Flexibility and deep pockets go a long way, but spotting important highs and lows is the icing on the cake that makes one money manager stand out from the crowded middle ground of mediocre, and increasingly difficult to achieve, investment returns.
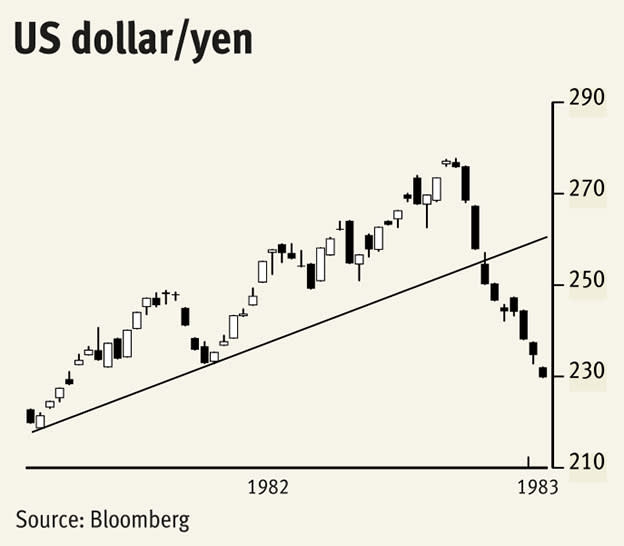
I believe that technical analysis has the edge here, flashing warning signals to the day – and sometimes to the hour – of significant market turns. My first lesson was in 1982 when I was responsible for keeping FX poster-sized bar charts up to date on the walls in the dealing room – by hand! Dollar/yen had been rallying steadily all year and in November it crashed through trend line support. Grandly I announced to the old boys that the market had turned for the US dollar. ‘The girlie’s’ street cred grew and grew as I had picked the very top, 277.50, since exchange rates were floated.
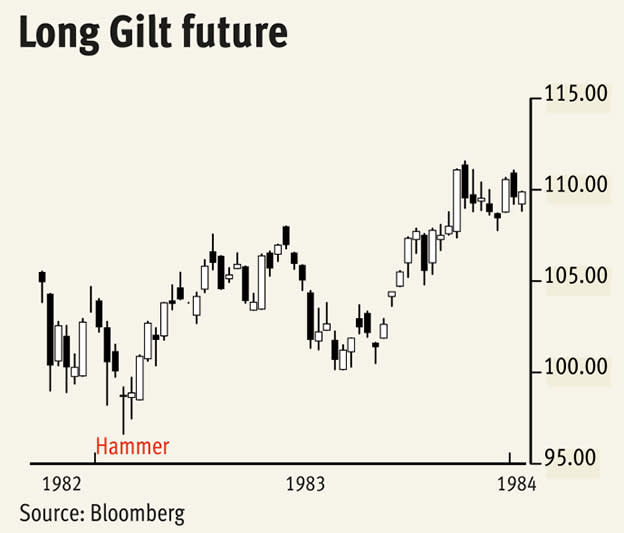
The next year I was thrown into the bear pit that was open outcry trading in the Long Gilt future. Filling client orders, and dabbling daily for the bank’s account – dual capacity, you understand – I continued drawing charts on graph paper stuck to the back of my trading cards; tick by tick point & figure ones by then. Gilt prices had been tumbling, and very expensive moves for those on the losing end. One morning we hit a new record low, then proceeded to recover all the losses by the afternoon’s close. Again, I announced to traders on my team, and to the stockbrokers in the booths around me, that we’d hit rock bottom. We had. These dramatic reversals often come in the shape of a hammer, sometimes a pennant, and if they have gaps on the way down and then on the way up again, they are called island reversals.
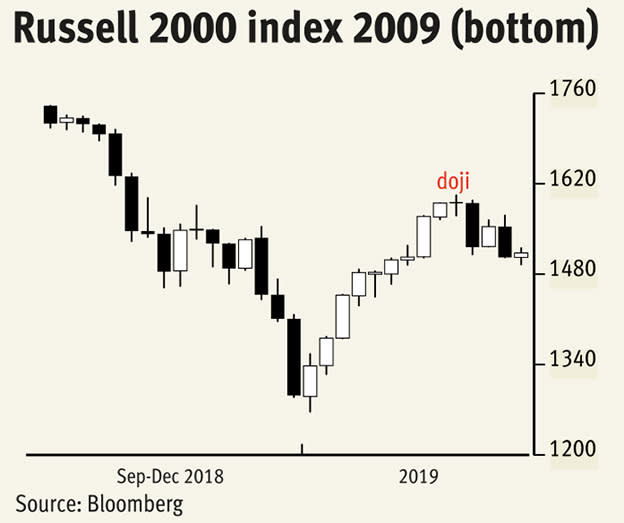
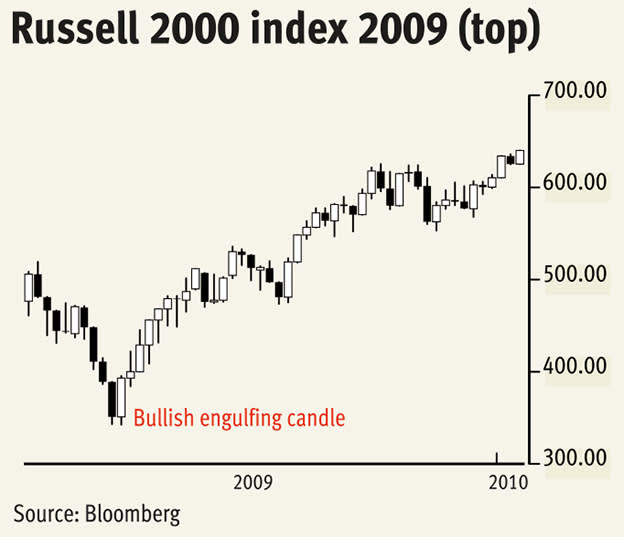
Something similar happened to equity indices in March 2009. Variations on the theme, I’ve picked the Russell 2000 as it’s one of the more skittish of a nervy bunch. Quarterly and monthly candles are hammers which follow what had been until then the worst ever three-month period for the index. The concept of fractals, where the shape of a candle or pattern mirrors that of a higher time frame, is an oft forgotten important element of technical analysis. The weekly candle was a bullish engulfing one and, while I realised we’d found an interim low, I never imagined it would lead to a decade-long bullish trend channel.
Over to the here and now and today, after the worst-ever quarterly slump, the Russell 2000 has managed nine consecutive weekly rallies this year. The Rule of 8 to 10 states that any market that has moved in one direction only for this number of periods, has a mature move that should turn imminently. A small weekly doji, denoting indecision, marks this year’s high and coincides with the level of the 200-day moving average which should cap again next quarter.