
The clocks went back, the weather’s foul, Halloween, All Saints Day and bonfire night went without a hitch. Today we look forward to Remembrance Sunday, many wearing poppies with pride. The countdown to Christmas is in full swing, retailers stacking the stuff high and hoping to shift it all – that’s if they last that long. It’s also the time of year when fund managers and private investors start thinking of winding down business, and doing back-of-the-envelope estimates of this calendar year’s performance.
Third-quarter results from most big banks have been disappointing, revenues from investment banking well down on last year, blamed on stagnant markets and lack of turnover. No volatility, no point trading, no bid-offer spread, no profit; simples. Looking at my performance in October, it’s been poor, to say the least, and again linked to markets that don’t move much – or at all, like spot gold which remains stuck between $1,480 and $1,520.
Considering the Brexit shenanigans and a looming general election, UK-focused markets were surprisingly calm last month. Cable was one of the better performing currencies, rallying 6.5 per cent, admittedly from very depressed levels. Interestingly, sterling’s weakness by historical standards has encouraged overseas investors to buy UK property, a steady flow from the Middle East picking up the pace as their political instability grows. The monthly chart shows a potential double bottom (W-shape) against $1.2000 – just about the lowest level since exchange rates floated in the 1970s. This hints at a rally to $1.4300 over the next eight months or so; not so far-fetched as we’ve been there post-referendum.

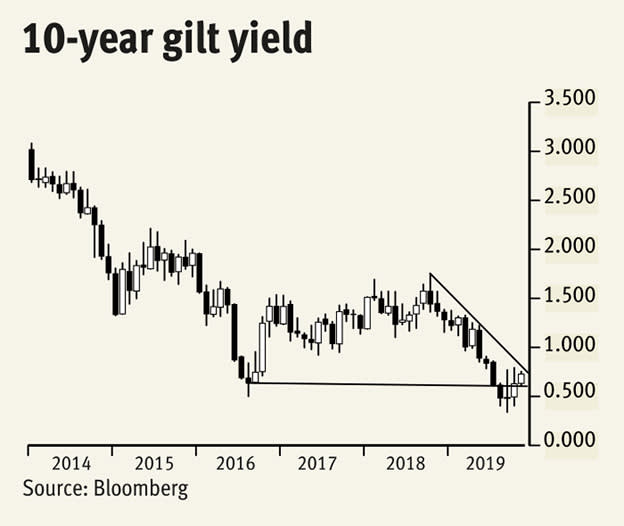
Benchmark gilt yields have moved sharply and erratically in both September and October; perhaps not unreasonable as they probe record lows and push towards the zero mark. We view this as consolidation at a new lower ledge, not a plateau, keeping the risk of moving in to negative nominal yields high. Trendline resistance is intact, we remain clearly below retracement resistance, and maybe leaving the EU will be postponed yet again – in which case European sovereign bond yields would remain closely linked.
I’m not bothering with the FTSE 100 chart as it’s been stuck at the mean regression at 7300 for nigh on three years. Instead, we’ll ring the changes and use the FTSE All-Share. Again, nothing much happened in October and no trend all year. What is worth noting about this chart is the series of upside attempts, starting in 2017, above the top of the ultra-broad, secular trend channel from 2000. It ought to have provided a toehold to further gains, but it hasn’t, which is a shame as slippage remains a continued risk.

Finally, Brent crude oil, which for the last five years has commanded a premium of about $6 over New York’s prices (the more international benchmark). A small range in October follows subdued price action all year, with a slight downward slant since April. Today we’re trading at this year’s mean regression of $61.50 per barrel, hinting at more small losses between now and the New Year. This is not the sort of news crown prince Mohammed bin Salman will be hoping for as he tries to offload a small portion of what’s billed as ‘the most profitable company in the world’ – Saudi Aramco.


