
Stimulus efforts have calmed markets, or at least induced a bear market bounce. Wall Street has notched up its best 3-day run since 1931. The close above 2630 was the highest for the S&P 500 since March 11th. US stocks rallied 6 per cent on the day despite weekly jobless numbers hitting a staggering 3.3m. The FTSE 100 broke key near-term resistance to close at 5815, also its best finish since Mar 11th.
This morning, European markets have pulled back a touch with caution being the order of the day after such a good rally. Friday rules apply – do you hold risk over the weekend? The FTSE opened under the 5700 level and moved to retest 5600. Bourses were 2-3 per cent lower in early trade.
We’d been noting the signs of stabilisation creeping into markets last week and thoughts turned to whether the market had found a bottom. It does not mean that there is not another leg lower to come if, say the death rate in New York spirals in the next fortnight, or 6 months from now we have massive second wave of infections.
Big questions are starting to be answered like how bad is the spread of infections, how bad is the economic damage, what stimulus is coming? Now are looking at how long do the lockdowns last, how quick is the recovery, are we hit by second, third waves? That is a recovery narrative, not panic, but if recovery is not as swift as hoped for, equity markets will suffer another hit.
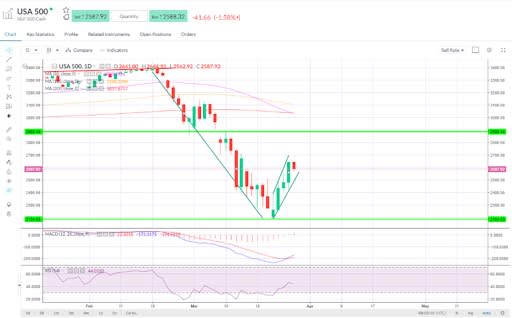
The S&P 500 is in a solid rising channel off the lows. On the longer term daily chart there is a bearish flag look about things for sure, which could suggest a another leg lower taking out the recent lows, but indicators are broadly positive still. Bear flag or second phase of an emerging bottom/ inverted H&S pattern? We could easily see a triple bottom here. The market can remain choppy around these levels for months.
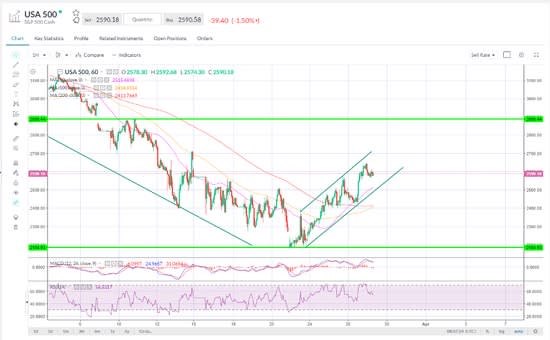
Hourly – positive momentum on the SMAs but MACD turning down, could test bottom end of the channel.
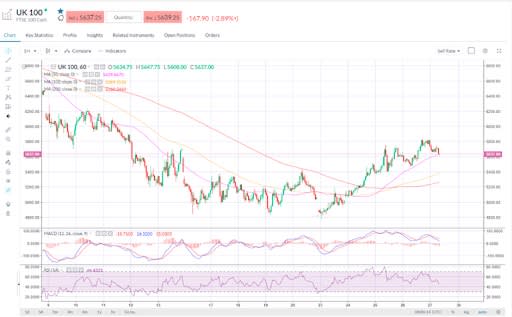
FTSE 100 – testing 50-hour SMA
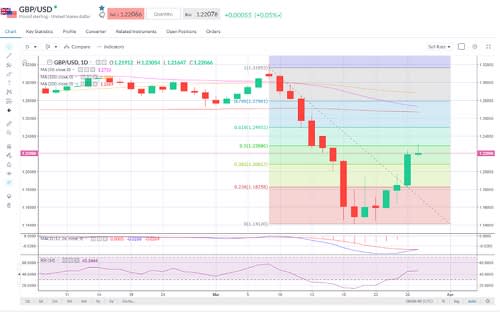
In FX, the pound is trading like a pure risk-on, risk-off play right now. Resistance at the 50% retracement around 1.228860 is key. The daily MACD is giving a positive signal.
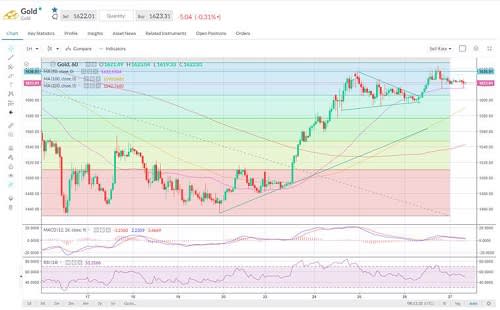
Gold broke out of the triangle but momentum failed to carry through. The 50-hour line is providing near-term support around $1615.
Neil Wilson is chief markets analyst at Markets.com


