- Instem doubles market cap in 12 months
- Data mining highly valuable for pharma companies
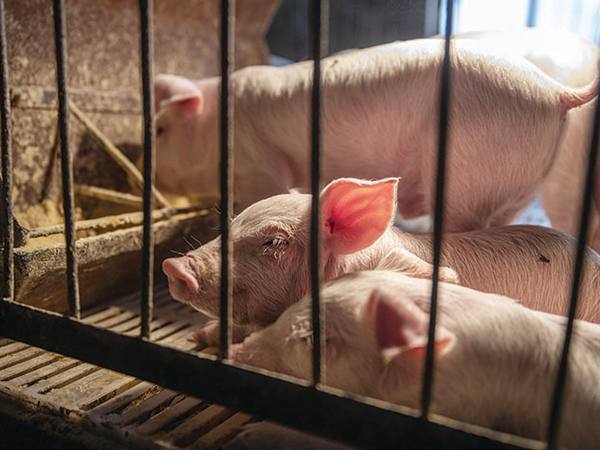
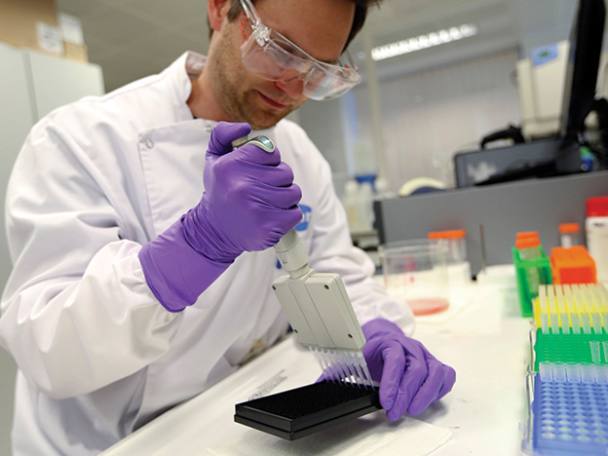
Software-as-a-service (SaaS) provider Instem (INS) is making its presence felt on the market after quietly doubling its market capitalisation over the past 12 months. That performance is now worth an in-depth look as the company consolidates its niche in providing specialist software for clients in the life science industries. Instem’s software allows pharmaceutical, biotech companies and contract research organisations to efficiently collate clinical and regulatory data, as well as enabling the data mining techniques that are used to sift large amounts of data for determining clinical statistical significance.
In other words, Instem’s offering is highly specialised, and the company currently appears to be focused on building scale in its operations, rather than returning cash to shareholders. There were two acquisitions during the half – The Edge software consultancy and software provider d-Wise – along with the post-period acquisition of Swiss company PDS Data Pathology Systems for CHF4.7m in cash (£3.8m) and CHF3.5m in new ordinary shares. All of these act to build up Instem’s capabilities, d-Wise, in particular, is interesting as it was the company’s main competitor. As with all software companies, Instem’s accounts testify to the complexity of receiving upfront payments for the future supply of good and services; deferred income in these results, which has to be booked as a liability on the balance sheet, was £14.2m and will eventually be moved to the income statement as services fall due.
House broker Singer Capital Markets forecasts a hefty forward PE of 31 for 2022, with no dividend yield. That is roughly par for the course when it comes to SaaS companies and, given that there are very few companies competing directly with Instem, it has room for growth. Hold.
Last IC View: na
| INSTEM (INS) | ||||
| ORD PRICE: | 902p | MARKET VALUE: | £ 200m | |
| TOUCH: | 890-910p | 12-MONTH HIGH: | 910p | LOW: 421p |
| DIVIDEND YIELD: | NIL | PE RATIO: | 119 | |
| NET ASSET VALUE: | 191p* | NET CASH: | £7.5m | |
| Half-year to 30 Jun | Total operating income (£m) | Pre-tax profit (£m) | Earnings per share (p) | Dividend per share (p) |
| 2020 | 14.0 | 1.90 | 9.50 | nil |
| 2021 | 19.8 | 1.18 | 4.80 | nil |
| % change | +41 | -38 | -49 | - |
| Ex-div: | - | |||
| Payment: | - | |||
| *Includes intangible assets of £43m, or 193p a share | ||||