- Beware of recency bias in cumulative returns
- Check the manager’s history before you invest
- Are they holding true to their investment philosophy?
2020 has been an extraordinary year for global markets. While some funds in the right sectors have made huge gains, others have had a terrible time. As we reach the end of the year, it can be worth taking stock of how different managers have fared and putting this information into a wider context.
Most equity fund managers ask you to judge them over a five-year period, which is reasonable as funds are designed to be long-term investments. Investing in equities in particular involves a significant amount of risk, so you have to expect volatility along the way. Funds will show you performance for at least five years on their factsheets, or for as long as the fund has existed, at least after its first year of existence. But one thing that is perhaps not so obvious is the extent to which longer-term data is skewed by recent performance.
The problem is that all performance tends to be shown to the same end date, something that can at times distort the figures. If it performed exceptionally well in the past six months or so, a fund may appear to have had strong returns over the past five years, even if performance for four and half of those years has in fact been lacklustre. Ben Yearsley, director at Shore Financial Planning, says cumulative five-year performance “doesn’t tell you a great” deal because of this recency bias. He encourages people to look at discrete performance, shown on most factsheets, where you can see how a fund has performed against its benchmark over different 12-month periods.
Average five-year rolling returns tend to show a clearer picture than a single snapshot. This looks at the total return over a number of five-year periods, which will smooth out performance, showing if a fund manager is performing according to their own criteria over time. Unfortunately, most funds do not produce charts showing this data, but historic fund prices can be found in fund factsheets past and present.
If you are assessing investment trusts, it is useful to look at net asset value (NAV) movements over time. This strips out the effects of market sentiment and gives you a better reflection of manager skill by focusing on the underlying fund returns. Chart 1 below shows the five-year rolling average NAV return for two very popular technology trusts, Polar Capital Technology (PCT) and Allianz Technology Trust (ATT), to illustrate how returns can be smoothed out.
The chart shows that over most five-year periods, the two trusts have delivered broadly the same NAV performance. There have been periods, such as over the last five years, when Allianz Technology Trust has performed significantly better, but Polar Capital Technology Trust looks less volatile. This could be down to the management style, as the Polar Capital trust has a significantly larger number of holdings and deliberately doesn’t veer too far from its benchmark.
Using the same data, it is also interesting to look at the average annual return for each five-year period, shown in Chart 2. In the case of the two tech funds discussed, it shows just how high the average annual return of technology stocks has been since the financial crisis.
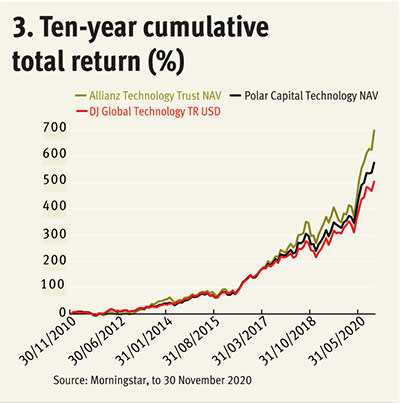
Compare these two charts with a five-year cumulative share price performance of both trusts. While we are not comparing like for like, many people understandably take more interest in share price returns because that is what you receive as an investor. It is less helpful, however, for determining the skill of the manager, partly because of the share price and NAV discrepancy but mainly because very little difference is shown between the two trusts in the early years and it appears skewed to recent returns.
Other performance metrics are also less useful than they might appear. Investment trusts, for example, are required to produce Key Information Documents, which show you how a trust might perform under a "stress", unfavourable, moderate or favourable scenario. These calculations are of little use when considering what future returns might be, given that they are based on past performance.
Check the manager history, not the fund's
When considering a new fund, it is important to check the history of its management. Sometimes new managers will have spent years in the fund team working closely with the previous managers, in which case it may be likely that little will change. If an entirely new manager is brought in, however, they may bring a significantly different investment approach. Reviewing the previous manager’s style might bear little resemblance to what you are currently assessing.
Complete management changes can happen with investments trusts if the board decides to replace an underperforming manager. In these instances, it is better to research how the new managers have performed in previous roles than to focus on the trust itself. A recent example of a change is Baillie Gifford’s appointment to Witan Pacific Trust, now called the Baillie Gifford China Growth Trust (BGCG). The trust, which was founded in 1907, was previously a pan-Asia multi-manager fund diversified across sectors and regions. Since September when the management transfer completed, the trust has looked radically different, with a China-only high conviction portfolio, and over 20 per cent of its assets in Alibaba (HKG:9988) and Tencent (HKG:700) alone. Given the new management, the trust’s historic performance is broadly irrelevant to people assessing it.
There are some tools that can help you assess a fund manager's record. Investment platform Bestinvest, for example, has a manager search function that enables you to search for fund managers by name, track record, or years of experience. Bestinvest's Manager Record Index does not include a full performance record for all managers, so it is best not used it as a single source of manager research
Fund rating providers such as Morningstar also tend to focus on rated funds' management teams and closely monitor the situation in the wake of any staff turnover. Platforms often do the same for funds on their buy lists, and each will provide updates on the new team and its approach.
Is the manager doing what they say they are doing?
The conviction of a fund manager is most tested in times of extreme market volatility, such as the sell-off (and subsequent rally) earlier this year. With equity growth funds, you want a manager who is flexible and ready to take advantage of market opportunities as they arise. But it is also important that they stick to their investment policy, because if a manager does not do what they say they are going to do then you can have little confidence in where your money is invested.
There is no single best approach to running money, and different styles are better suited to different market environments. In recent years the so-called ‘growth’ style has, on average, delivered better performance than ‘value’ funds whose managers look to buy stocks on low valuations, often in cyclical sectors. Following such a difficult period for value investing, it might be easy to see why they could be tempted to move into growth names. However, Jason Hollands, managing director at Tilney, says he would be wary of any manager who says they have a value-style but runs a fund with a price/earnings ratio that looks significantly higher than the market's. Value funds that have drifted into growth stocks over the last decade will benefit less than those that haven’t if there is a significant rotation to value, as we saw in November, and fail to provide you with as much diversification from the growth part of your portfolio.
You can check the price/earnings ratio of funds on data provider Morningstar’s website, to check that a fund’s valuation is in line with your expectations. As at 4 December, the forward looking price/earnings ratio (next 12 months) of the FTSE 100 was 15.5 per cent, according to FactSet data, and 18.8 per cent for the FTSE 250. Although these numbers should be taken with a pinch of salt given the uncertainty that still lingers over the global recovery from the pandemic.
Other ratios that will help you assess a fund's manager are those that measure risk. A number of ratios can be found by searching the fund in the ‘market data’ section of the Investors Chronicle website. All risk measures shown have a comparison with the category average. The standard deviation sheds light on a fund’s historic volatility, with the higher the number the higher the fund’s volatility record. The Sharpe ratio is used to help investors understand the return of an investment compared to its risk, with the higher the number the more attractive the risk and return profile.
It is also worth checking whether a manager has done their job in a major market event. A huge sell-off is a good excuse to check whether funds or assets with a defensive remit have protected your capital, or at least taken less pain than the broader equity market. Similarly, it is worth looking at how a value manager has fared against their rivals, and against value stocks and sectors, in cyclical rallies such as the one we saw in November.
You should also have a look at what the fund holds, to check there are no surprises. If you are investing in an income fund, and the fund holds a high proportion of non-dividend paying stocks, this should be a warning sign. The Woodford Equity Income Fund, for example, held a relatively high proportion of unlisted non-dividend paying stocks and this ended up being disastrous for investors. While the industry has learned a sharp lesson from the Woodford debacle, it is a good example of why high-profile fund managers must be assessed and not blindly trusted.


