
- The screen underperformed its benchmark over the past 12 months but still delivered a 34 per cent total return
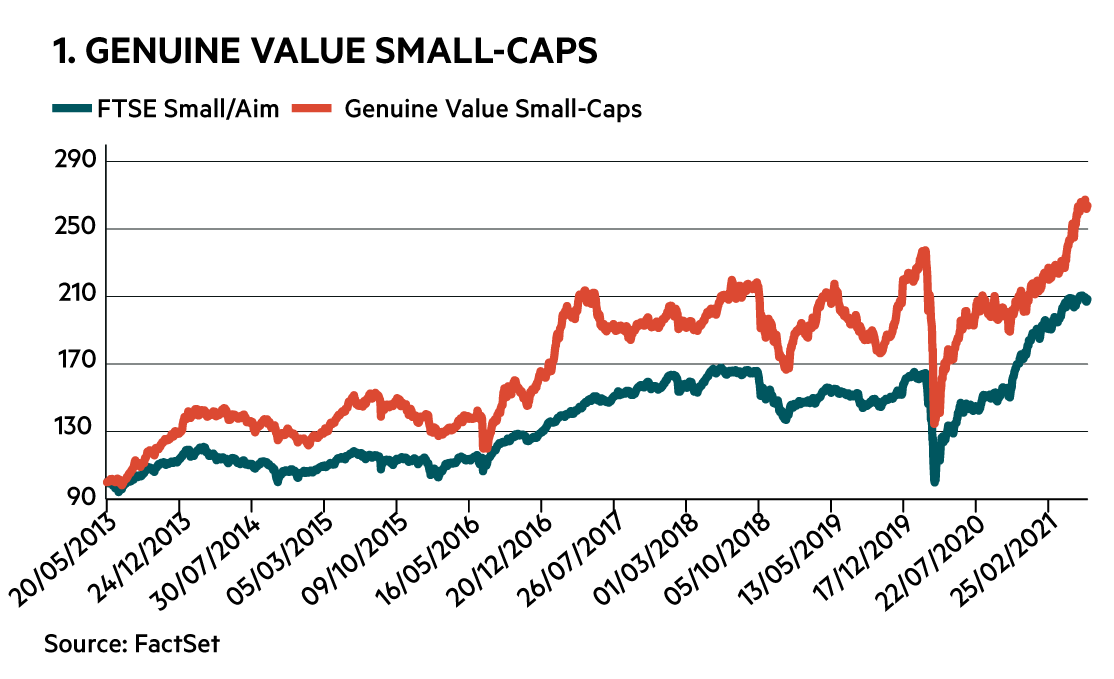
- Over the eight years since launch the cumulative total return stands at 170 per cent versus 110 per cent
- 5 new Genuine Value Small Cap plays for the coming year
Last year, when I ran my Genuine Value Small Cap screen I did so with a “health warning” attached. The fact was that the extraordinary circumstances caused by the pandemic were making a key input unreliable. The input in question was brokers’ growth forecasts.
Despite the health warning, I also suggested the screen still had value in generating ideas, but the ideas needed to be approached with caution and in the context of the peculiar circumstances. As it happens, this seems to broadly have proved the case. While the screen on aggregate did not keep up with the small-cap rally over the past 12 months, it did produce strong numbers and very high returns from some individual shares.
| 12-month performance | ||
|---|---|---|
| Name | TIDM | Total Rtn (8 Jul 2020 - 24 Jun 2021) |
| Morses Club | MCL | 79% |
| DWF | DWF | 76% |
| Flowtech Fluidpower | FLO | 57% |
| Burford Capital | BUR | 50% |
| City Of London Inv.Gp. | CLIG | 45% |
| De La Rue Ord | DLAR | 36% |
| Capital Ltd | CAPD | 29% |
| Photo-Me Intl. | PHTM | 28% |
| Stock Spirits | STCK | 22% |
| Zambeef Products | ZAM | 6.5% |
| Anglo Asian Mining | AAZ | 2.1% |
| Caledonia Mining | CMCL | -26% |
| GV Small | - | 34% |
| FTSE Small Cap | - | 47% |
| FTSE Aim All Share | - | 41% |
| FTSE Small/Aim | - | 44% |
| Source: Thomson Reuters | ||
From a longer-term perspective, the cumulative total return from the screen over the eight years I’ve run it is 170 per cent compared with 110 per cent from a 50:50 split between the FTSE Small Cap and Aim indices. While the screens are meant as a source of ideas rather than off-the-shelf portfolios, if I add in an annual 2.5 per cent charge to represent notional dealing costs, which tend to be higher for smaller companies due to wider spreads, the total return drops to 120 per cent.
A year on from my mid-pandemic screen, and it feels as though the circumstances are once again very peculiar, but this time for different reasons. Once again the cause is rooted in the pandemic.
Many companies are now forecast to show atypically strong growth as earnings recover from a very low base. The idea behind the key valuation ratio this screen is based on (see criteria) is that shares should be valued against growth that is representative of longer-term prospects rather than a one off jump. The fact that many companies have just got through truly awful financial years means that another key input to the valuation ratio may mislead; the price/earnings (PE) ratio.
So, once again, my message would be to handle the results of this screen with care, although there are definitely some good-quality, albeit cyclical, businesses among the results. I’ve taken a closer look at the stock experiencing the biggest three-month upgrades below, Epwin (EPWN). For me, the shares look as though they may have been lifted too high by the so-called value-rotation, although a recent trend in upgrades could prove me wrong.
Four other stocks have also been highlighted by the screen and fundamentals relating to all the picks can be found in the table at the end of this article.
Epwin
Since listing in 2014, PVC building materials firm Epwin looks like a company that has been spending a fair bit of money with not much to show for it. The key metric that indicates this is the company’s so-called capital turnover. Capital turnover measures the level of sales generated per pound of capital employed by a business. The deleterious trend over the past five years can be seen in the chart below. It’s worth noting that while I’ve tried to adjust 2019 and 2020 figures for changes in lease accounting rules, the attempts to create comparative numbers may not be perfect.
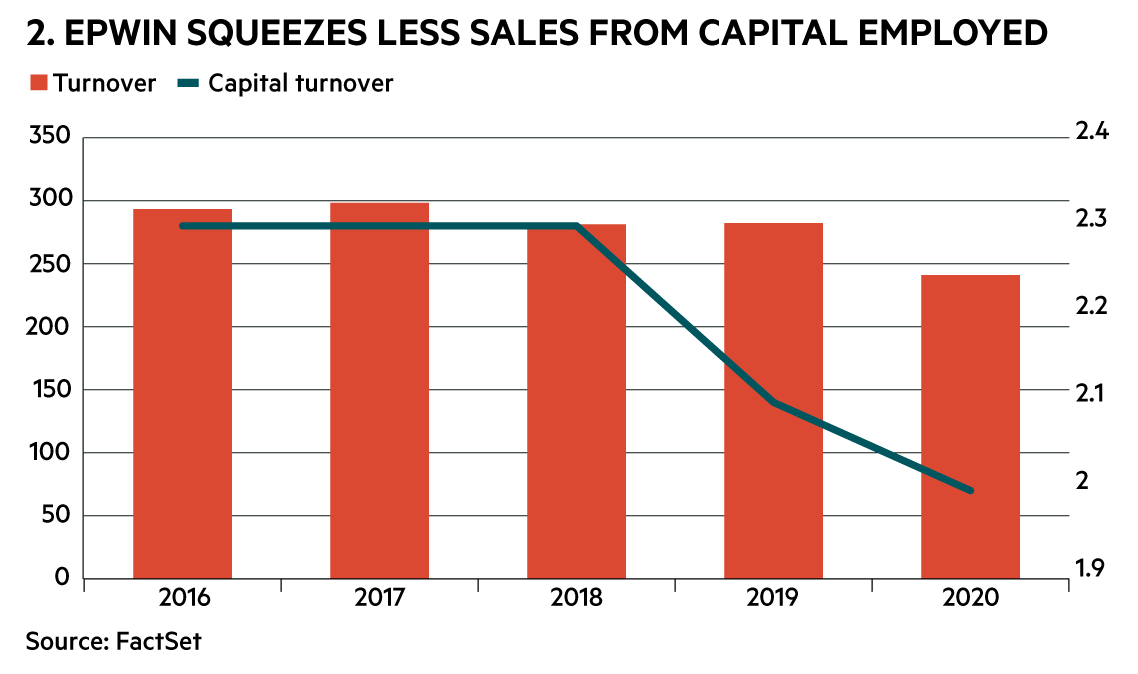
Capital turnover is one of the determinants of the popular return on capital employed (ROCE) measure of business quality. ROCE tells us the amount of operating profit a company generates for every pound spent. The other determinant of ROCE is operating margin.
Given there are few competitive advantages to be had in the business of making and selling PVC fittings and fixtures, despite investment in efficiency improvements, the group’s margins are okay but uninspiring. They are likely to remain that way. Pre-Covid adjusted operating margins were 7.5 per cent in 2019.
The big question for the Genuine Value screen is whether the downward trend in capital turnover is because the company has been unlucky, or because of weaknesses that mean the shares are best avoided.
One important positive is that the company itself has been around since 1976 and is a leader in a number of its end markets. It also looks in relatively good financial shape. While it has significant lease liabilities (rental commitments) of £84m, it only owed lenders £19m at the end of its last financial year.
It also generates cash. Something investors should be aware of when reading the company’s accounts is that it presents free cash flow before lease repayments whereas a better method is to include these outflows as I’ve done in the accompanying chart. What is arguably unreasonably harsh is that I’ve also excluded the benefits of sales and leasebacks. But even with this treatment, we can see cash is coming in.

The company has put forward excuses for disappointing sales and profit performances over recent years. In 2017, profits were squeezed due to rising input prices. That year it also lost its two biggest clients, each accounting for about 5 per cent of revenue. These losses were really felt in the 2018 financial year. Hopefully such painful client losses won’t be repeated, but the event underlines the threat of competition. In 2019, the replacement, maintenance and improvement (RMI) market, which accounts for about 70 per cent of sales, was weak. And then in 2020 we had Covid-19.
These events are all understandable, but the litany of misfortune also points to a business that is not a master of its own destiny. Still, luck tends to balance out over time and maybe Epwin’s fortunes will not be quite as bad in the future.
From a glass-half-full perspective, there is arguably something to feel positive about in the fact that Epwin has been running hard to stand still. Investment in acquisitions, new facilities and efficiency improvements means there could be potential to unlock should Epwin finally get a fair wind behind it in trading terms.
In its first year as a listed company in 2015, it spent £32m on two acquisitions. It followed this up in 2016 with the £10m purchase of National Plastics. Deals have continued since, but the price tags have been much more diminutive, perhaps reflecting the limited progress since that early acquisitive flurry. Most recently it spent £2.5m on decking company PVS in February.
Epwin, which manufactures as well as distributes its products, has also invested a fair bit of money in improving its facilities using sales and leasebacks to recoup the cash. Meanwhile, the costs associated with this restructuring have resulted in regular “exceptional” costs. Over the past five years, non-underlying items have accounted for 15 per cent of reported underlying operating profits.
The fact that money has been spent with little bottom line progress is illustrated by the accompanying chart depicting ROCE and operating profit against spending on Capex and acquisitions.

The bull case is that the company now has a lot of gas in the tank. The bear argument would be that capital allocation has simply been poor.
One party supporting the bull case is Edison, a firm that is paid by companies to produce research on them. Edison is forecasting that it will take until 2023 before EPS is back above 2019 levels. That year it’s pencilled in 8.9p.
Encouragingly, Epwin’s trading in the second half of 2020 was strong and there has also been a good start to the current year. Lockdown has benefited enthusiasm for home improvements. Recent forecast upgrades provide some grounds for hope that things will be better than Edison expects, but raw material price rises are a reason for trepidation.
In all, Epwin looks as though it operates in a tough market and the track record means it has much to prove. The valuation of the shares has benefited from the value rally since November’s vaccine breakthroughs. The shares are priced at 12.6 times Edison’s 2023 earnings forecast. Pre-Covid (to the end of 2019), the mid-way next-12-month price/earnings (NTM PE) ratio was 7.7. The pre-Covid high for the shares was 12.6 times NTM forecasts (the same as the 2023 PE today). The valuation was hit when the stars briefly looked aligned for the company back in 2015. The NTM PE low was 5.0 in 2017.
The screen may say the shares offer “genuine value”, however, I find this questionable given the history.
| FIVE CHEAP SMALL-CAP GROWTH PLAYS (including Epwin) | ||||||||||||||||
|---|---|---|---|---|---|---|---|---|---|---|---|---|---|---|---|---|
| Name | TIDM | Mkt Cap | Net Cash / Debt(-)* | Price | Fwd PE (+12mths) | Fwd DY (+12mths) | FCF yld (+12mths) | GV Ratio | Net Debt / Ebitda | Op Cash/ Ebitda | EBIT Margin | ROCE | Fwd EPS grth FY+1 | Fwd EPS grth FY+2 | 3-mth Mom | 3-mth Fwd EPS change% |
| Epwin | EPWN | £157m | -£99m | 108p | 15 | 3.2% | - | 0.4 | 3.4 x | 40% | 5.1% | 6.4% | 51% | 46% | 12.4% | 20.7% |
| T Clarke | CTO | £53m | £7m | 124p | 7 | 3.8% | 11.6% | 0.2 | - | 28% | 2.5% | 18.9% | 59% | 37% | 17.8% | 17.7% |
| Motorpoint | MOTR | £308m | -£43m | 342p | 20 | - | - | 0.6 | 2.4 x | 38% | 1.7% | 10.6% | 85% | 46% | 30.0% | 13.0% |
| S&U | SUS | £317m | -£100m | 2,610p | 14 | 4.0% | - | 0.2 | 1.7 x | 70% | - | 20.2% | 33% | 37% | 22.0% | 9.1% |
| STM Group | STM | £20m | - | 34p | 8 | 5.0% | - | 0.0 | - | 59% | - | - | 30% | 34% | 13.3% | 6.8% |
| Source: FactSet | ||||||||||||||||