

Passive investing is a relatively new phenomenon, and has spurred the widespread adoption of index funds and exchange traded funds in recent decades. But the idea of a stock market benchmark – against which passive and active equity strategies can be judged – has much older roots.
In fact, those roots trace back to 1884. That was the year the world’s first equity index, the Dow Jones Transportation Average, was created as a way for US investors to gauge the financial performance of the then-dominant railroad industry. Twelve years later it was joined by the Dow Jones Industrial Average (DJIA), initially comprised of a dozen stocks in sectors ranging from manufacturing to energy production, and lead smelting to cattle feeding.
In 1991, almost a century after its creation, the DJIA – or more colloquially ‘The Dow’ – had expanded to 30 companies. But it was still seen as a proxy for the health of the US economy, and a well-followed measure of equity returns. This ubiquity was also a big reason for the acclaim which greeted that year’s publication of Beating the Dow, in which fund manager Michael O’Higgins outlined one of the most famous stock-picking strategies of all time.
The other reason was the simplicity of the methodology, known as the ‘Dogs of the Dow’. As O’Higgins’ website of the same name outlines, it involves just a couple of steps:
“After the stock market closes on the last day of the year, of the 30 stocks that make up the DJIA, select the ten stocks which have the highest dividend yield. Then simply get in touch with your broker and invest an equal dollar amount in each of these ten high-yield stocks. Then hold these ten ‘Dogs of the Dow’ for one year. Repeat these steps each and every year. That’s it!”
The theory behind this contrarian approach was, and remains, easy to understand.
Historically – and somewhat paradoxically – high trailing dividend yields have often been a sign of out-of-favour or undesirable stocks because they signal doubts about a firm’s ability to grow its earnings. At the same time, companies that are sufficiently large and successful to make it into the Dow tend to have well-established brands, economies of scale, plentiful access to cheap credit and excellent management.
This means a high dividend yield – and a dog-like reputation – can prove to be signs of fundamental value that the market has not yet priced in. By taking a counter-intuitive approach to beaten-up stocks, investors can look through markets’ propensity toward irrationality and wild swings in sentiment.
There may be no such thing as a free lunch, but – at the risk of torturing the metaphor – sometimes tomorrow’s portion will be just as big if not bigger, even if it is on sale.
The method also worked. Quant legend James O’Shaughnessy back-tested the method as far back as the 1920s and found that the Dogs outperformed the broader Dow by two percentage points a year, without incurring any additional risk.
According to later editions of O’Higgins’ book, the formula “spawned a veritable industry, including websites, mutual funds, and $20bn worth of investments”.
The success didn’t last. In A Random Walk Down Wall Street, the US economist Burton G. Malkiel notes how frenzied marketing of the strategy during the bull run of the nineties eventually gave way to a period of consistent underperformance. O’Higgins later acknowledged that “the strategy became too popular”.
Power of the Dogs?
Recent years haven’t been especially kind to the Dogs, either. Data from O’Higgins’ website shows the strategy has underperformed the DJIA in 11 of the past 15 years on an absolute return basis. The relatively thin spread between the dividend yield of the Dogs and the broader index means investors would have done better to stick their money in an index tracker, especially when dealing charges and taxes are factored in.
In share price terms, the Dogs are up just 71 per cent since the start of 2007, compared with 212 per cent for the DJIA.
| DJIA | Dogs | |
| 2007 | 6.4% | -1.4% |
| 2008 | -33.8% | -41.6% |
| 2009 | 18.8% | 12.9% |
| 2010 | 15.5% | 11.0% |
| 2011 | 5.5% | 12.2% |
| 2012 | 7.3% | 5.7% |
| 2013 | 30.3% | 26.5% |
| 2014 | 7.5% | 7.0% |
| 2015 | -2.2% | -1.2% |
| 2016 | 13.4% | 16.1% |
| 2017 | 25.1% | 19.4% |
| 2018 | -5.6% | -3.7% |
| 2019 | 22.3% | 15.4% |
| 2020 | 7.2% | -12.7% |
| 2021 | 18.7% | 11.0% |
| 15-yr return* | 212.3% | 70.8% |
| Source: dogsofthedow.com *Excludes dividends | ||
A couple of factors help to account for these mixed returns. First, the best-performing US stocks over the past decade have typically been in fast-growing industries with plentiful opportunities to reinvest capital. Even when higher dividend yields have undersold Dogs’ improving fortunes, they have typically underperformed the Dow’s star constituent, Apple (US:AAPL), on a rolling one-year basis.
Second, while the DJIA’s return profile has not lagged the more tech-heavy S&P 500 too drastically (see chart), it probably has a greater share of companies in industries facing long-term secular challenges. Third, the method’s focus on dividend yield now arguably underplays US companies’ preferred form of shareholder returns: the buyback.

Dogs with two tales
In short, recent events suggest we should let underperforming dogs lie. But that assumes the Dow is currently the most appropriate hunting ground for unloved companies whose resilience is underappreciated. What about home turf?
Between 2007 and 2013, this magazine ran a version of the Dogs of the Dow for the FTSE 100, which beat the blue-chip index more often than not. The past five years have also highlighted the power of the strategy when hunting in a market more familiar to Investors’ Chronicle readers. Applying O’Higgins’ method for the 20 highest-yielding stocks in the FTSE 100 Index – and refreshing the selections on 31 March each year – a ‘Dogs of the FTSE’ strategy would have yielded a total return of 52.4 per cent over the past five years, versus 28.9 per cent from the benchmark.
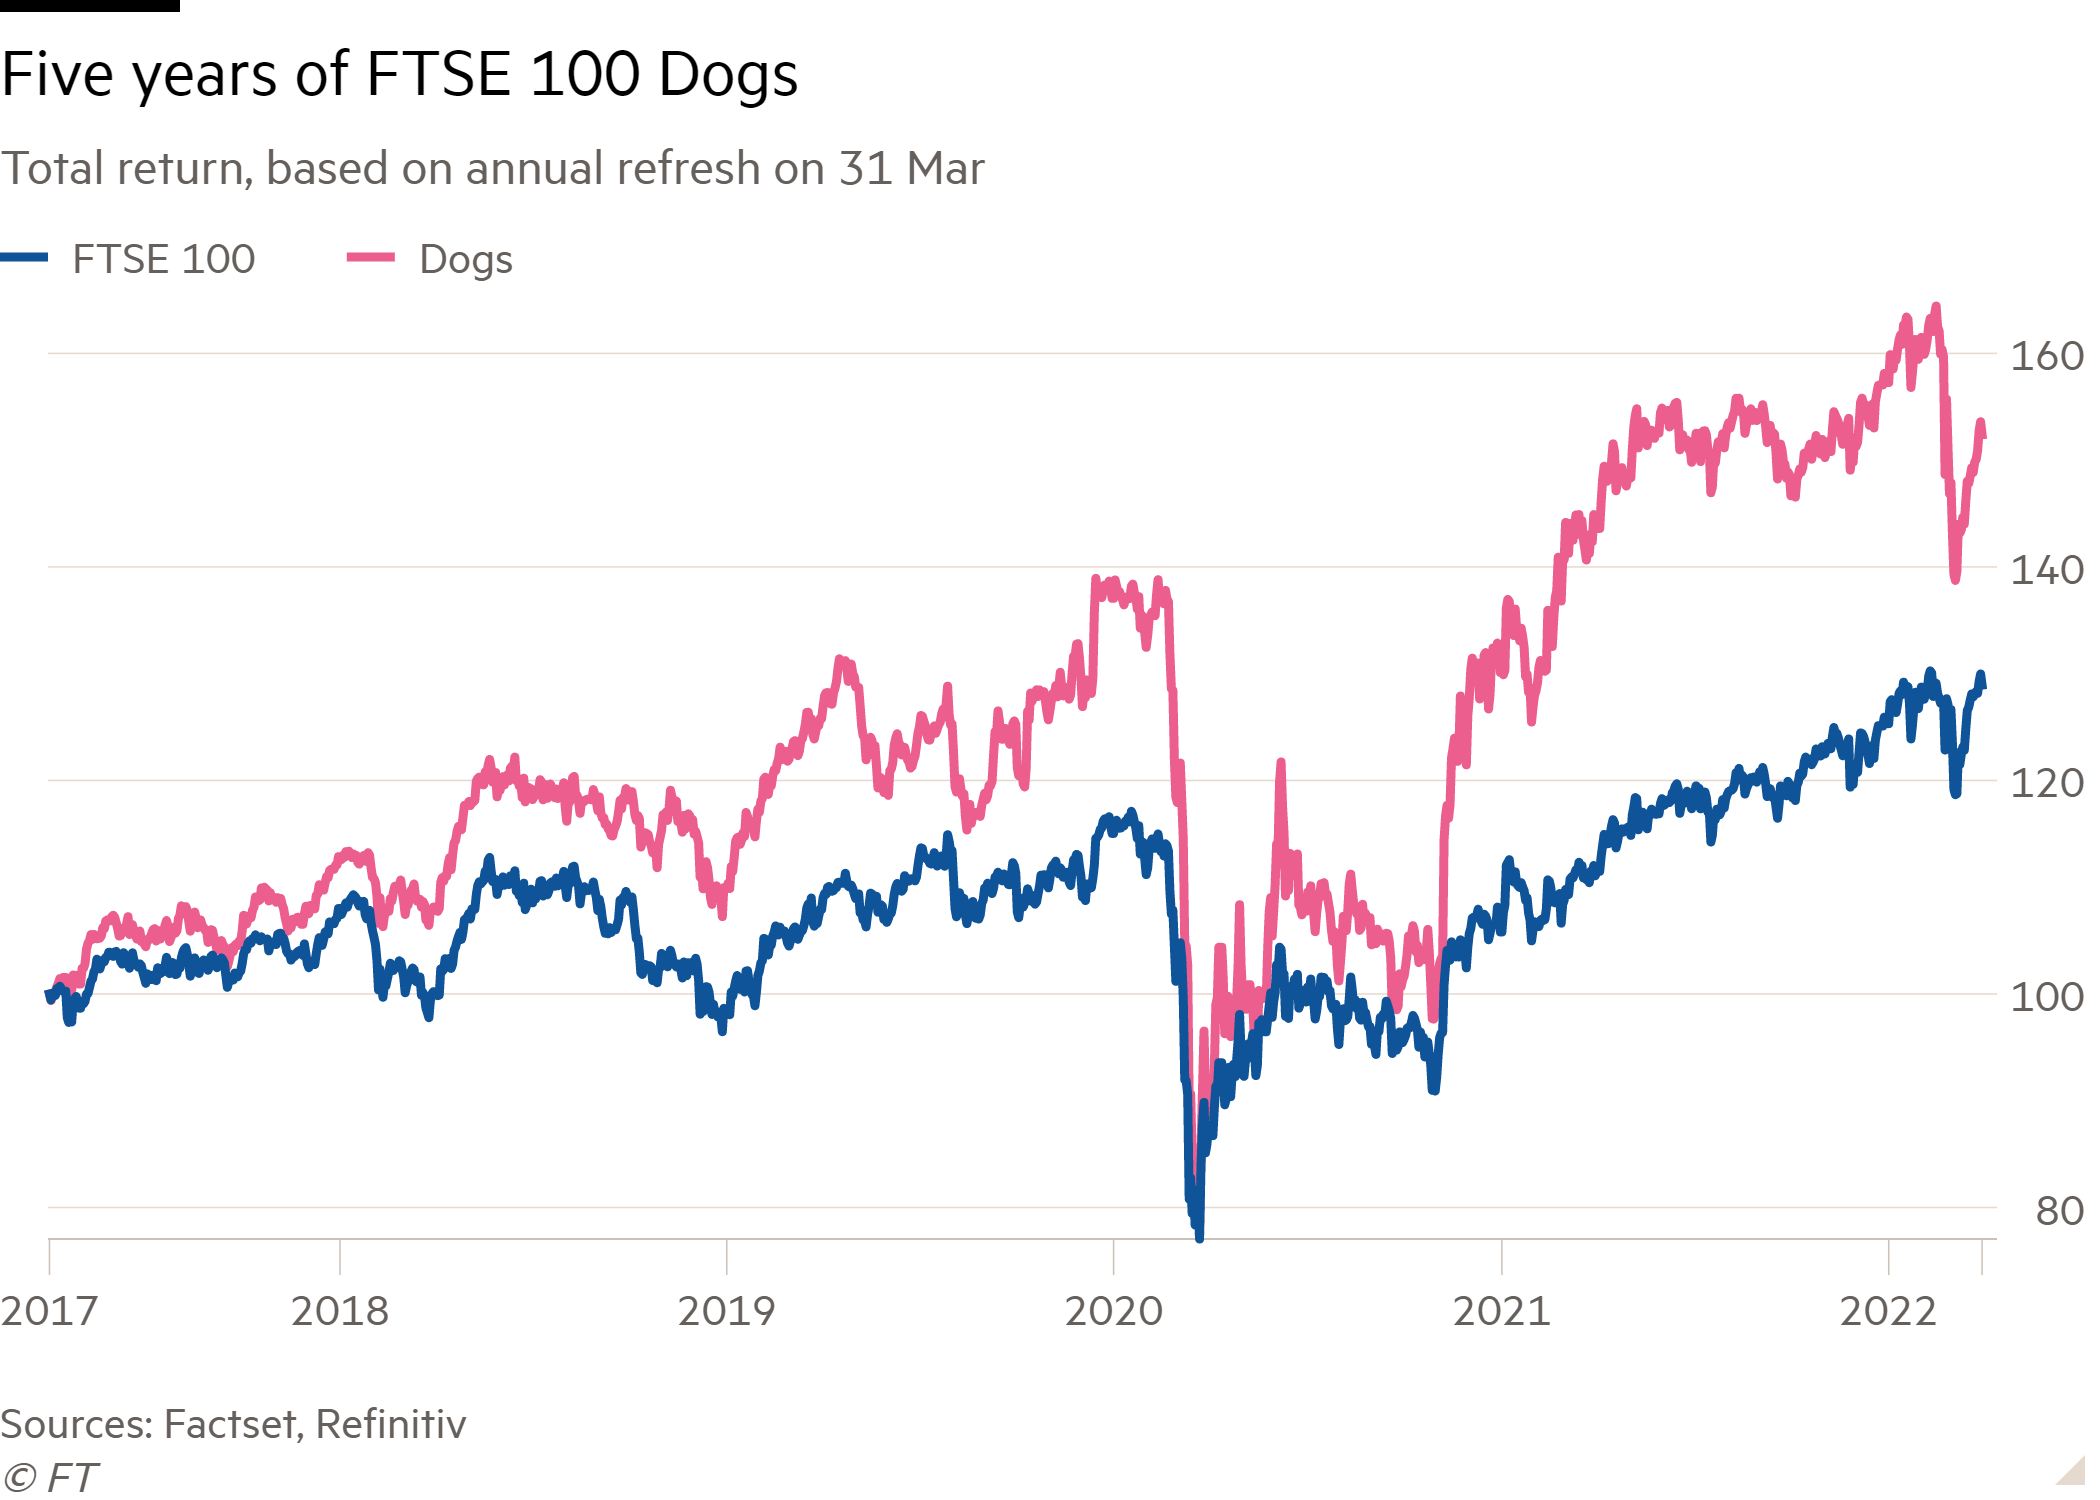
Even after factoring in a 1 per cent annual dealing charge to rebalance the portfolio, our UK Dogs would have returned 7.3 per cent per year on average, versus 5.2 per cent from the FTSE100. Interestingly, the price of this alpha would have been both greater volatility and a sharper maximum drawdown in the value of the portfolio.
| Dogs | FTSE 100 | |
| 2017 | 8.1% | 0.2% |
| 2018 | 16.3% | 7.7% |
| 2019 | -27.7% | -18.8% |
| 2020 | 57.9% | 26.8% |
| 2021 | 6.1% | 16.1% |
| 5-yr CAGR | 8.8% | 5.2% |
| With dealing | 7.3% | 5.2% |
| Max drawdown | -44.0% | -34.2% |
| Beta | 1.92 | 1 |
Source: FactSet, Refinitiv Datastream
Depending on your perspective, its stunning outperformance in the year after March 2020 highlights the strengths of a contrary deep-value stock-picking method, or the extreme volatility that accompanies any major portfolio reset in the middle of a market crisis.
This year’s picks – which follow the same simple methodology outlined above – are detailed below, along with their five-year dividend growth rate, cover and consensus payout forecasts for the next two years.
A crude average of these figures reveals some key differences with the index. After a higher rate of dividend growth in recent years, cover is now thinner, and distributions are expected to fade over the next 24 months.
At the same time, the share prices of these stocks have outperformed the FTSE 100 over the past three months. A heavy weighting to commodities has no doubt helped. So too the current vogue for value. Time will tell whether this can be sustained.
| Company | TIDM | Mkt Cap | Price | Fwd NTM PE | DY | DY NTM | DY STM | 5yr DPS CAGR | Divi Cover | 3-mth Momentum |
| Admiral | ADM | £7,716m | 2,573p | 17 | 10.8% | 6.6% | 5.6% | 19.5% | 0.7 | -18% |
| Rio Tinto | RIO | £75,902m | 6,076p | 8 | 9.5% | 9.6% | 6.8% | 33.9% | 1.6 | 24% |
| Imperial Brands | IMB | £15,544m | 1,636p | 6 | 8.5% | 8.8% | 9.3% | -2.2% | 2.2 | 1% |
| M&G | MNG | £5,758m | 222p | 10 | 8.3% | 9.2% | 9.0% | - | 0.2 | 10% |
| Anglo American | AAL | £53,182m | 3,976p | 8 | 7.8% | 5.7% | 4.6% | - | 1.6 | 32% |
| Phoenix | PHNX | £6,339m | 634p | 8 | 7.7% | 7.9% | 8.1% | 3.1% | - | -2% |
| Abrdn | ABDN | £4,675m | 214p | 16 | 6.8% | 6.8% | 6.8% | -8.4% | 3.2 | -11% |
| Legal & General | LGEN | £16,305m | 273p | 8 | 6.8% | 7.2% | 7.5% | 5.2% | 1.9 | -8% |
| British American Tobacco | BATS | £74,021m | 3,242p | 9 | 6.7% | 7.2% | 7.7% | 5.2% | 1.4 | 19% |
| Taylor Wimpey | TW | £4,898m | 135p | 7 | 6.4% | 7.2% | 8.2% | 24.9% | 1.8 | -23% |
| Barratt Developments | BDEV | £5,348m | 523p | 7 | 6.3% | 8.5% | 9.5% | -0.9% | 2.0 | -30% |
| Antofagasta | ANTO | £16,824m | 1,707p | 19 | 6.3% | 3.3% | 2.9% | 49.9% | 0.9 | 27% |
| Vodafone | VOD | £36,709m | 129p | 12 | 5.9% | 6.0% | 6.0% | -7.4% | - | 15% |
| Hargreaves Lansdown | HL | £4,904m | 1,034p | 20 | 4.9% | 4.1% | 4.3% | 8.2% | 1.1 | -24% |
| Aviva | AV | £16,751m | 454p | 10 | 4.9% | 6.7% | 7.1% | -1.1% | 0.5 | 10% |
| Royal Mail | RMG | £3,304m | 346p | 6 | 4.8% | 6.7% | 7.3% | -14.7% | 5.2 | -33% |
| GlaxoSmithKline | GSK | £84,433m | 1,661p | 14 | 4.8% | 3.2% | 3.3% | 0.0% | 1.1 | 3% |
| NatWest | NWG | £23,310m | 219p | 10 | 4.8% | 6.7% | 6.3% | - | 2.4 | -3% |
| SSE | SSE | £18,689m | 1,750p | 16 | 4.7% | 5.1% | 3.7% | -2.0% | 3.0 | 6% |
| Kingfisher | KGF | £5,416m | 265p | 9 | 4.7% | 4.6% | 4.8% | 3.6% | 3.3 | -24% |
| Dogs Average | £24,001m | 11 | 6.6% | 6.5% | 6.4% | 6.9% | 1.9 | -1% | ||
| FTSE 100 Average | - | £21,269m | - | 16 | 3.0% | 3.7% | 3.9% | 3.9% | 4.2 | -6% |
| Source: FactSet, as of 31 Mar 2022. NTM = next 12 months, STM = following 12 months | ||||||||||


