The trainers market has been running on a treadmill at full pelt for the last decade. No longer simply used for playing sports or for casualwear, trainers are now as likely to be spotted walking the floors of corporate offices as they are on high-end catwalks.
- Attractively valued compared with peers
- Strong brand supported by high marketing spend
- Margin growth driven by higher direct-to-consumer sales
- Track record of shareholder returns
- Ongoing Covid-19 restrictions in China
- Changing trends in consumer spending
Collectible Adidas (Ger:ADS) footwear designed with the help of luxury fashion house Chanel and celebrity rapper Pharrell Williams cost over $1,000 a pair, and often fetch ten times that at resale. This means big business for the German brand, which is now the second most valuable apparel brand in the world, according to Kantar, which also reported the rise and rise of ‘athleisure’ brands such as Lululemon (US:LULU) and Puma (DE:PUM) in its yearly brands list.
Adidas got its start earlier than most in 1949, receiving its moniker from co-founder ‘Adi’ Dassler. Today, the German brand sells a range of shoes, clothing, and sports equipment in more than 2,100 Adidas-owned stores, 15,000 franchises, and around 150,000 wholesale offerings worldwide, not to mention an online channel that has sprinted ahead in the last few years. Meanwhile, Adidas has diversified itself geographically, with the Americas and Europe together representing a little more than half of total sales. The Asia-Pacific region – where the brand manufactures the bulk of its products – now accounts for one-third of revenues.
Growth at a bargain
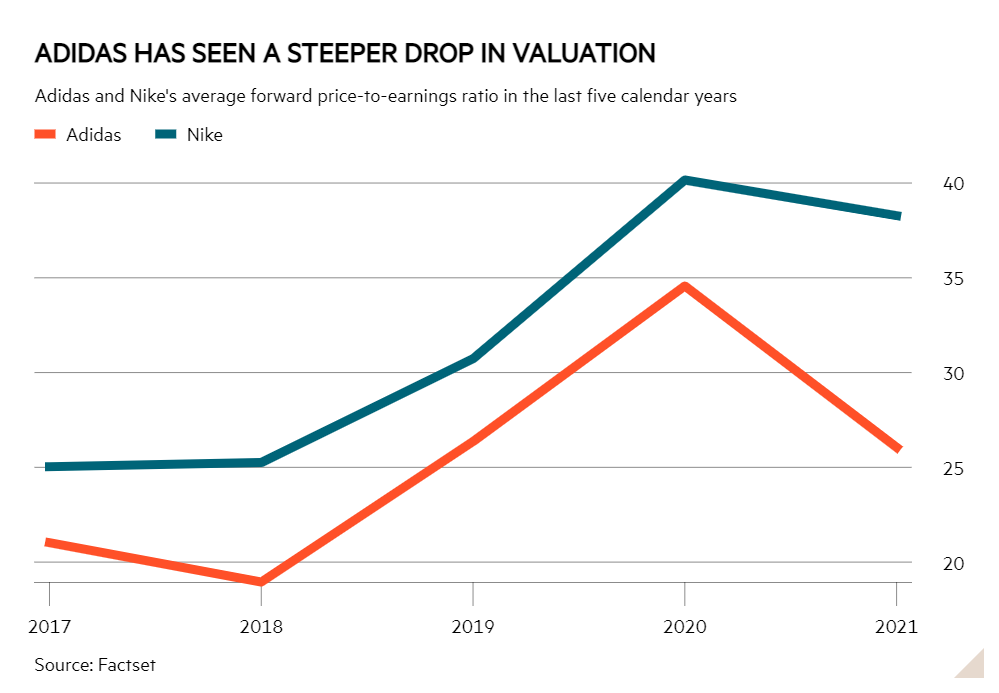
Adidas’ worldwide reach has not managed to defend it against a sharp 35 per cent drop in its share price this year, as soaring inflation and economic shutdowns in China piled pressure on consumer discretionary stocks. Investors have not treated all athleisure brands alike, though, and Adidas has fallen deeper into the shadow of its larger rival Nike (US:NKE) in 2022, which controls a market-leading 25 per cent of the fitness-and-fashion footwear category. Runner-up Adidas’ takes 15 per cent of the market, a difference that is usually reflected by a small valuation gap between the two stocks. This year the gap has turned into a gulf, with Nike shares currently valued at 24 times forward earnings, while Adidas lags behind on a forward price to earnings (PE) multiple below 17 – a seven-year low for the stock.
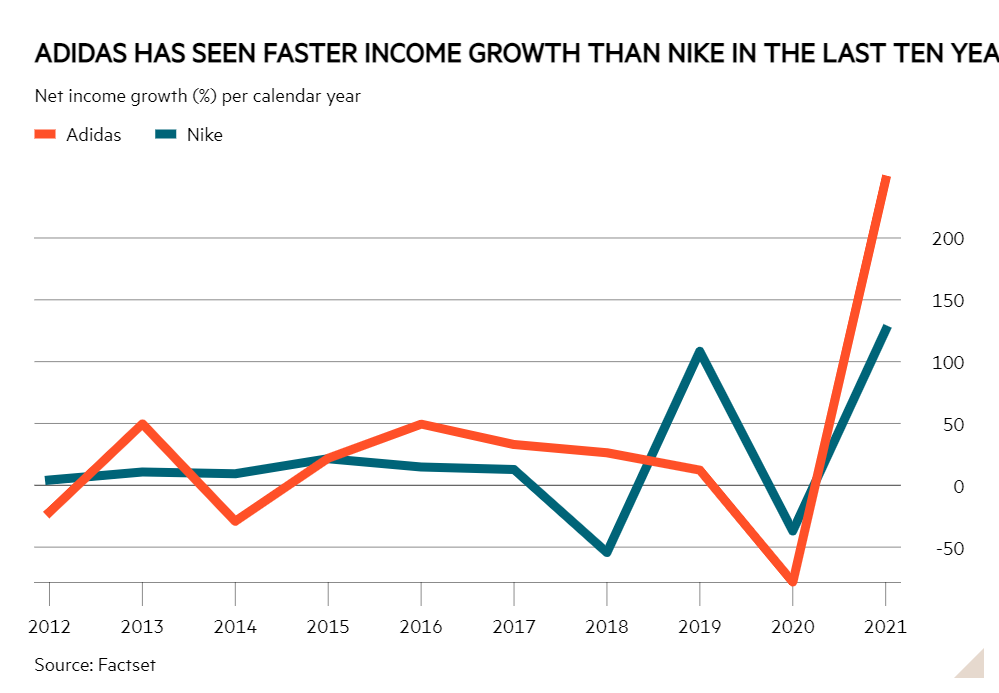
These valuations look particularly out of balance since well-heeled Adidas has been growing its annual net income faster than Nike for most of the last decade. The European brand is even trailing its smaller rival Puma, which started as a breakaway brand founded by Adi’s brother Rudolf, and commands a forward PE ratio of 22 despite making only a third of its elder sibling’s yearly sales. However, this combination of growth and value has kept Adidas among the favourite holdings of leading international fund managers, according to recent research from Investors’ Chronicle.
As the two largest players in the sportswear market, Nike and Adidas are not dissimilar, charging premium prices and wielding colossal marketing budgets. According to analysts at Morningstar Equity Research, “only Nike and Adidas have the financial resources and worldwide appeal” to do this, while smaller competitors Under Armour (US:UAA) and Puma lack the “star power” to sign sponsorships with the top global athletes and teams. Adidas’ sponsorships, including football teams Manchester United and Real Madrid, and sports stars Lionel Messi and Caroline Wozniacki, accounted for about 50 per cent of its roughly €2.5bn (£2.2bn) in total marketing expenditures in 2021.
Recession planning
These investments in its intangible assets could position Adidas well for a recession. This is when the power of a strong brand really comes to light, historically enabling certain firms to emerge relatively unscathed, retaining both customers and high prices while less established competitors lose out. Adidas’ pricing power is already evident, with a 10-year average gross margin of 50 per cent, which is higher than Nike’s – and due to its higher mix of clothing and sports equipment sales. Indeed, broker Jefferies recently recommended Adidas as one of the “best global non-defensive stagflation plays”, having outperformed in at least four out of the past five stagflation-like episodes.
The gross margin is expected to hit 55 per cent in 2024, from an estimated 52 per cent in 2022, according to Morningstar. This growth is courtesy of Adidas’ ‘Own the Game’ strategy, a bid to increase its Direct-To-Consumer (DTC) sales which the brand debuted in 2021. Around 60 per cent of Adidas’ sales are currently through multi-brand retailers like JD Sports (JD), and moving away from this model would allow Adidas to pocket the entire profit from a pair of trainers, while also stopping retailers from feeding off its high marketing spend. Management aims to make DTC account for over half of revenues by 2025, while doubling its ecommerce sales to €9bn (£7.8bn). Jefferies analysts noted that the DTC push is progressing, with growth in North America speeding up to over 20 per cent in the first quarter of 2022. Meanwhile, Adidas’ own digital sales push is starting to bear fruit, with sales near doubling in three years to almost €4bn in 2021.
Headwinds in Asia
One of the major factors that has held Adidas back this year is its deepening ties with China. It is clear this is impacting sales, as revenues fell 16 per cent in Asia Pacific during the three months to the end of March. It is also hampering future growth plans in which Chinese markets had been expected to play a key role as the fastest-growing athleisure market in the world. Management expects to counterbalance this slowdown with “strong double-digit” growth across the other 80 per cent of the business. First-quarter constant currency sales growth of 12.8 and 9.1 per cent in North America and Emea, respectively, suggests core markets can still deliver. And while it is difficult to predict when China’s periodic tightening of restrictions will be phased out, or what effect they will have on consumer spending, the brand’s Chinese growth looks delayed rather than over.
Strong shareholder returns
One more reason to take heart lies in Adidas' improving position on shareholder returns. Investors have had gripes with management over its spending in the past, as they were perceived to have overpaid for Adidas' most-recent acquisition, Austria-based fitness app Runtastic, bought for $240mn (£200mn) in 2015. Meanwhile, last year Adidas took a hefty loss on Reebok, which it sold for €2.1bn to Authentic Brands Group at a steep discount to the €3.1bn it paid for the brand in 2006.
Management appears to have learned from these mistakes. Washing its hands of Reebok has helped Adidas to pay down €600mn of debt in 2021, while also replacing a revolving credit facility with a better credit line that allows it to pay its usual dividend. The firm has doubled its dividend payout since 2015 through incremental rises and is on track to generate a 2.4 per cent yield in the next year. There is little sign that management will divert from this course, and analysts forecast that Adidas will spend €3.7bn on dividends in the next five years, out of the €12.5bn it will generate in cumulative free cash flow, of which another €7bn will go toward stock repurchases.
Although there is still uncertainty over Adidas’ exposure to China, its strong position in the growing athleisure market looks likely to set it apart from smaller rivals over the tricky years ahead. In the meantime, the combination of healthy cash generation and generous disbursements provides plenty of upside for shareholders.
| Company Details | Name | Mkt Cap | Price | 52-Wk Hi/Lo |
| adidas AG (ADS) | €32.5bn | €169.68 | €336 / €165 | |
| Size/Debt | NAV per share* | Net Cash / Debt(-)* | Net Debt / Ebitda | Op Cash/ Ebitda |
| €41.01 | €-2.38bn | 0.5 x | 94% |
| Valuation | Fwd PE (+12mths) | Fwd DY (+12mths) | FCF yld (+12mths) | EV/Sales |
| 17 | 2.4% | 6.0% | 1.7 | |
| Quality/ Growth | EBIT Margin | ROCE | 5yr Sales CAGR | 5yr EPS CAGR |
| 7.9% | 15.5% | 2.8% | 16.4% | |
| Forecasts/ Momentum | Fwd EPS grth NTM | Fwd EPS grth STM | 3-mth Mom | 3-mth Fwd EPS change% |
| 23% | 21% | -16.8% | -0.8% |
| Year End 31 Dec | Sales (€bn) | Profit before tax (€bn) | EPS (c) | DPS (c) |
| 2019 | 23.6 | 2.56 | 970 | 335 |
| 2020 | 19.8 | 0.58 | 215 | 284 |
| 2021 | 21.2 | 1.85 | 747 | 328 |
| Forecast 2022 | 24.1 | 2.19 | 916 | 368 |
| Forecast 2023 | 26.2 | 2.71 | 1,126 | 446 |
| Change (%) | +9 | +24 | +23 | +21 |
| Source: FactSet, adjusted PTP and EPS figures | ||||
| NTM = Next 12 months | ||||
| STM = Second 12 months (ie, one year from now) | ||||