The Alternative Investment Market (Aim) hardly has the image of the place to visit in search of high-yield stocks. Perhaps that notion is in need of some fine-tuning. True, with an average dividend yield of about 1.4 per cent among the 700 or so component companies of the FTSE Aim All-Share index – not many more than 200 of which are likely to pay a dividend this year – it is not an obvious happy hunting ground for income-stock investors. Even so, its dividends are still recovering strongly from 2020’s wipe-out and pay-outs are set to rise by over 13 per cent this year.
According to financial-services administrator Link Group in its annual AIM Dividend Monitor, regular dividends, excluding special pay-outs, rose almost 20 per cent in the first half of 2022. Despite likely moderation in that growth rate in the second half, underlying pay-outs for the full year should still run out more than 13 per cent higher than 2021’s.
True, these amounts remain below pre-Covid levels. Assuming Aim companies hit Link’s targets, then regular dividends will go past 2017’s levels this year. Add in special dividends, which are still running at high levels compared with earlier years, and 2022’s total distributions will be exceeded only by 2019’s record amount and will just beat 2021’s £1.2bn.
The chart puts some of the details into a longer-term context and compares the dividend-paying ability of the FTSE Aim All-Share index with that of its senior sibling, the FTSE All-Share index of fully-listed stocks. Recovering dividends mean that the dividend yield on the AIM index has doubled from its low point in the spring of 2021; though, at 1.4 per cent, it is still well short of its peak levels of 2014.
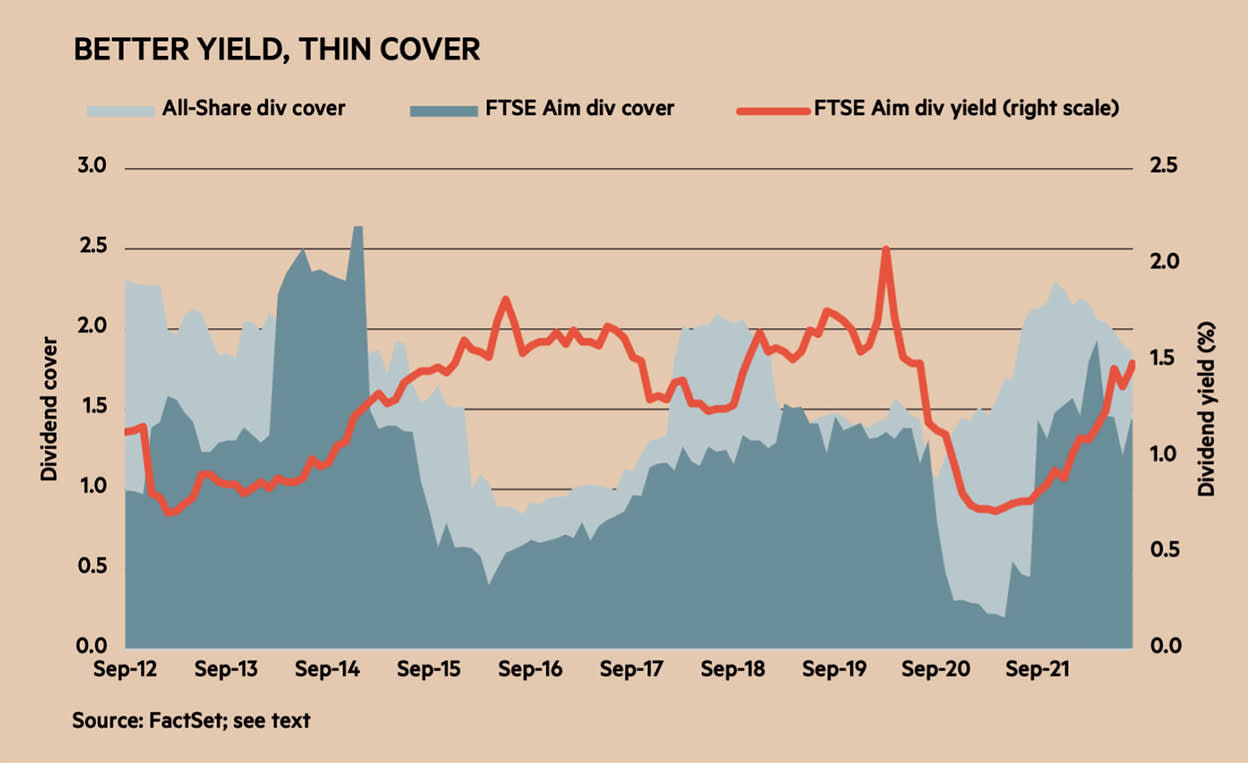
Further growth in dividends is likely to be constrained by a lack of distributable profit. After all, as the chart shows, even now cover for the AIM index’s dividends is pretty tight. While dividend cover has improved from its lowest levels of early 2021, at its current 1.4 times earnings – or a pay-out ratio of about 70 per cent of earnings – it is below both its fattest levels and the average for the All-Share index of listed stocks, where cover is running at about 1.8 times.
Some caveats are needed. The chart shows only the implied dividend cover for both indices. That is, cover has been extracted by dividing dividend yield into the earnings yield, the latter of which is found by turning the price-to-earnings ratio on its head (ie, finding its reciprocal). In theory, this is logical enough. For example, take the 46 times earnings on which the Aim index currently trades. That is the same as saying the index’s earnings yield is 2.2 per cent. Take that and divide it by the Aim index’s 1.5 per cent dividend yield and cover is round about 1.4 times, including some rounding error. The short coming is that data for the Aim index’s PE ratio includes some weird figures that need to be smoothed out. Even after doing that, the Aim index’s average dividend cover for much of 2014 and early 2015, coming in above the levels of the All-Share index, looks oddly high.
Such are the perils of investment analysis. However, dig down to the granular level to examine the income and the prospects offered by individual stocks on Aim and some feasible candidates suggest themselves. The table shows brief stats on 13 of them.
| BASIC STATS ON 13 AIM POSSIBILITIES | |||||||||
| Share price (p) | Change on 1 yr (%) | Mkt Cap (£m) | PE ratio* | Div yield (%)* | Pay-out ratio (%) | Profit margin (%) | Return on assets (%) | Debt to Ebitda | |
| i3 Energy | 25.55 | 122 | 305 | 3.8 | 4.7 | 18 | 14.6 | 10.2 | 0.2 |
| M.P. Evans | 830 | 14 | 453 | 6.2 | 5.5 | 34 | 35.5 | 15.3 | 0.0 |
| Pan African Resources | 17.72 | 6 | 394 | 4.1 | 7.8 | 32 | 29.3 | 17.1 | 0.3 |
| Smart Metering Systems | 886 | -9 | 1,181 | 66.9 | 3.4 | 228 | 16.9 | 0.7 | -2.2 |
| Belvoir Group | 225 | -20 | 84 | 11.1 | 4.0 | 45 | 31.5 | 15.5 | 0.2 |
| Brickability | 81.5 | -21 | 244 | 8.1 | 3.9 | 31 | 4.8 | 4.7 | 0.3 |
| Finsbury Food | 71 | -22 | 93 | 6.1 | 3.5 | 22 | 5.6 | 5.5 | 0.8 |
| Hargreaves Services | 425 | -22 | 138 | 6.2 | 4.9 | 31 | 2.6 | 14.3 | 0.4 |
| James Halstead | 200 | -29 | 834 | 21.4 | 3.9 | 83 | 19.4 | 17.7 | -1.3 |
| Michelmersh Brick | 90.5 | -37 | 87 | 10.0 | 4.1 | 41 | 16.1 | 5.4 | -0.5 |
| Portmeirion | 340 | -45 | 48 | 5.9 | 5.6 | 33 | 6.9 | 3.5 | 0.5 |
| Sanderson Design | 92 | -55 | 65 | 6.5 | 4.1 | 27 | 5.8 | 7.6 | -1.1 |
| Cake Box | 145 | -59 | 58 | 13.9 | 3.6 | 50 | 21.3 | 28.2 | -0.3 |
| *Based on current year City forecasts. Source: FactSet | |||||||||
First point to note, and perhaps the most important, is that most have put in a poor share-price performance over the past year; in the case of those at the foot of the table, especially poor. So most of these offer a superior dividend yield only because their share price is depressed. But that prompts the thought, is this just a blip in performance or does the share-price weakness tell us something depressing about each company’s longer-term outlook? Put another way, will momentum continue to drag falling share prices further down, or will mean reversion kick in to reverse that trend?
Easier to ask the question than to answer it. That said, the 13 were selected mostly because forecasts for their current-year earnings and dividends produce both an acceptable dividend yield and dividend cover. The unweighted average for the 13 is a 4.5 per cent yield with cover of almost two times (52 per cent pay-out ratio).
Similarly, some emphasis went on choosing those with decent profit margins (to provide protection for profits in hard times), with a high return on assets (implying that capital is used efficiently) and without the encumbrance of too much debt; indeed, five of the 13 had no net debt at their most recent balance-sheet date and none shows a ratio of net debt to ebitda (ie, cash operating profit) higher than 0.8
Obviously, some are exceptions to those guides. Brickability (BRCK) is basically a wholesaler of building materials so narrow profit margins are a way of life, though its return on assets looks a bit thin. Finsbury Foods (FIF) is in the bakery business where tough competition drives down returns of all types. Hargreaves Services (HSP) is a re-invented coal distributor which has turned itself into an industrial services provider of various sorts but whose real value lies in its balance sheet where its tangible book value per share, at 549p, is well in excess of its share price.
The exceptionally good performer among the 13 is i3 Energy (I3E), which combines oil and gas production in Canada with appraisal wells in the UK’s North Sea whose attractions have swelled enormously this year. Thus i3 is in the happy position of generating enough cash both to distribute generously to shareholders – dividends have been paid monthly since March – and to fund its capital spending. Management is committed to distributing 1.05p per share for 2022, though City analysts reckon that amount will be exceeded and the prospective 4.7 per cent yield shown in the table is based on a 1.2p pay-out.
As with almost all small oil and gas explorers, the question is, when the going is good, how long will it last? Back in February, the company’s City adviser suggested the shares were worth 30.5p each. If that figure has not been increased, it still offers 20 per cent upside, though that’s probably not a sufficiently wide margin of safety for sensible investors. Still, more should be known when i3 releases its first-half results for 2022 later this month.
Elsewhere, there is a former Bearbull holding, gold miner Pan African Resources (PAF), whose price, at 17.7p, is not much higher than when Bearbull bought in early 2017. Somehow, that’s how it is with Pan African, its price rarely escapes a narrow band between 10p and 25p come what may.
One whose price has escaped is Smart Metering Systems (SMS), which installs inter-active power meters and whose rating, at 67 times forecast earnings, seems almost higher than the others put together. Sure, owning its shares would have been a great hedge against the rising energy costs of the ‘Net Zero Transition’ and everyone knows smart meters bring more benefit to suppliers than to consumers. Maybe that’s why their roll out has been slower than the power industry hoped for and I would guess a lot of future roll out is in Smart Metering’s price.
Perhaps most tempting is long-term Investors’ Chronicle favourite James Halstead (JHD), whose share price has fallen on comparatively hard times – it is 36 per cent below its 2022 high – as costs faced by the floor-coverings maker rise and profit margins tighten. Even so, its bosses say sales for the year to end June were about 10 per cent up on the year. Meanwhile, the coming recession is pushing customers towards the comparatively cheap solution offered by Halstead’s vinyl products and its management has already stocked up in anticipation of further rises in input costs. In short, no factors suggest that Halstead will struggle to maintain the near-inexorable rise in its dividends, whose growth has compounded at 7.5 per cent annually since 2012. If any of the 13 go into the Bearbull Income Fund, to replace another Aim stock, R&Q Insurance (RQIH), it would surely be Halstead.