- R&D spend up 30 per cent on 2021
- Revenue growth still driven by mainland China
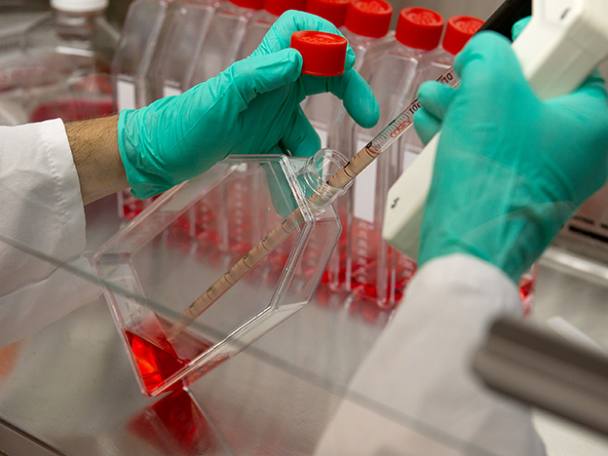
Hong Kong-based Hutchmed (HCM), which makes the vast majority of its sales inside mainland China, is branching out. Earlier this year, the pharmaceutical company signed a licensing deal for its cancer treatment fruquintinib with Takeda Pharmaceutical.
The agreement will allow the Japanese company to develop and commercialise the drug in all territories outside of mainland China, Hong Kong and Macau. Hutchmed could, in turn, receive up to $1.13bn (£0.93bn), including $400mn upfront and up to $730mn in potential milestone payments.
This looks to be the beginning of a global expansion for Hutchmed, which saw total revenue grow by one-fifth in its 2022 financial year. The company attributed its performance to commercial progress on its three in-house oncology drugs in China.
Last year’s growth was also set against the challenging backdrop of Covid-19 lockdowns in the first half. The company’s research and development (R&D) spend grew almost 30 per cent to $387mn in 2022 – $171mn of which was incurred in the US and Europe.
Management has indicated that it plans to extend its existing cash runway into 2023 through partnerships, as well as a renewed focus on its more advanced clinical assets. These drugs “are most likely to drive near-term value, particularly the global regulatory approvals and partnership of fruquintinib outside of China”, the company said in its results.
Hutchmed is also working with AstraZeneca (AZN) on studies of gastric cancer drug savolitinib. The UK pharma giant has thus far paid Hutchmed $85mn of a total of $140mn in possible payments under a licensing and collaboration agreement.
Although Hutchmed has yet to turn a profit for investors, we think it nonetheless represents a unique opportunity to gain exposure to China’s fast-growing pharmaceutical sector. Buy.
Last IC View: Buy, 209p, 1 Aug 2022
| HUTCHMED CHINA (HCM) | ||||
| ORD PRICE: | 282p | MARKET VALUE: | £2bn | |
| TOUCH: | 280-285p | 12-MONTH HIGH: | 422p | LOW: 130p |
| DIVIDEND YIELD: | nil | PE RATIO: | na | |
| NET ASSET VALUE: | 71¢ | NET CASH: | $613mn | |
| Year to 31 Dec | Turnover ($mn) | Pre-tax profit ($mn) | Earnings per share (¢) | Dividend per share (¢) |
| 2018 | 214 | -86.7 | -11.0 | nil |
| 2019 | 205 | -141 | -16.0 | nil |
| 2020 | 228 | -190 | -18.0 | nil |
| 2021 | 356 | -216 | -0.25 | nil |
| 2022 | 426 | -410 | -0.43 | nil |
| % change | +20 | - | - | - |
| Ex-div: | na | |||
| Payment: | na |