

- Who ever said greed isn't good? 10-year cumulative returns of 229 per cent from my Have it All screen
- Solid performance over the last 12 months
- Seven new Have it All shares
It’s starting to look a lot like Christmas! Well, it is for my stock screens at least.
My Have It All screen is always full of festive spirit. At least it is if your Christmas is deeply entwined with the consumerist festive tradition so revelled in by children. That’s to say, my Have It All screen is a greedy little blighter. It has a list for Santa that would elicit blushes from any aspiring Little Lord Fauntleroy.
But as Christmas veterans know, getting everything one wants is not necessarily the route to all happiness. And that is the problem the Have it All screen encounters every year. Fortunately, though, while there are always some inevitable lumps of coal to unwrap under this particular stock-screening Christmas tree, they tend to not exist in such great quantity as to overshadow the investment delights. Over the last 10 years the screen has produced a 229 per cent cumulative total return, or 198 per cent assuming a 1.5 per cent annual charge. That compares with 110 per cent from the FTSE All-Share.

While the screen has outperformed in seven of the 10 individual years I’ve monitored it, the ride has been as bumpy as a sleigh pulled by a sherry-fuelled Santa. The screen’s maximum peak-to-trough drop over the decade has been a nerve jingle-jangling 46 per cent compared with 36 per cent from the index. By these standards, the modest outperformance of the index over the last year represents a relatively sedate period.
12-MONTH PERFORMANCE
| Name | TIDM | Total Retrun (19 Jan 2021 - 27 Nov 2021) |
| Liontrust Asset Mgmt | LIO | 67% |
| DWF | DWF | 40% |
| Evraz | EVR | 33% |
| B&M European Val.Ret. | BME | 28% |
| City Of London Inv.Gp. | CLIG | 22% |
| Anglo American | AAL | 19% |
| Integrafin Holdings | IHP | 9.5% |
| Ferrexpo | FXPO | 6.3% |
| Bhp Group | BHP | 5.4% |
| Plus500 | PLUS | 3.1% |
| Diversified Energy Company | DEC | 1.3% |
| Berkeley Group Holdings (The) | BKG | -0.6% |
| Ig Group Holdings | IGG | -8.0% |
| Rio Tinto | RIO | -10% |
| Polymetal International | POLY | -13% |
| FTSE All Share | - | 12.8% |
| Have It All | - | 13.5% |
Source: Thomson Datastream
The screen looks for shares that are cheap in companies that display classic quality characteristics and also offer attractive forecasts and historical growth; a turkey-with-all-the-trimmings investment case. But the problem this screen encounters is that when stocks display so many obviously attractive fundamentals, they often also display risks that are not so easily captured in the numbers.
Indeed, the results from the screen should be very much considered as ideas for further research rather than an off-the-shelf portfolio. The stock I have taken a closer look at below, Morgan Sindall (MGNS), is a great example of the type of things that can be missed by focusing only on popular fundamentals. But an exploration of the investment case also reveals some noteworthy attractions, too.
The screen’s full criteria are:
VALUATION TESTS
■ Forecast next-12-month price/earnings (PE) ratio among the lowest third of all stocks screened.
■ Forecast next-12-month dividend yield (DY) in the highest third of all stocks screened.
■ Forecast next-12-month free cash flow yield (FCF yld) in the highest third of all stocks screened.
GROWTH & QUALITY TESTS
■ Average forecast earnings per share (EPS) growth in the next two financial years of 5 per cent or more.
■ Three-year EPS compound annual growth rate (CAGR) of 10 per cent or more.
■ Three-year free cash flow CAGR of 10 per cent or more.
■ Three-year dividend CAGR of 5 per cent or more.
■ Return on equity (RoE) of 10 per cent or more.
■ Three-year average RoE of 15 per cent or more.
Only one stock passed all the tests this year, Polymetal International. One stock does not make for a very full stocking! I’ve therefore bulked up results by allowing stocks to be included that pass just one of the three valuation tests and also fail one of the six other screen tests. Doing this increases the number of Have it All stocks to seven. Details of all the stocks can be found in the table at the end of this article.
MORGAN SINDALL
| Company Details | Name | TIDM | Desription | Price |
| Morgan Sindall | MGNS | Engineering & Construction | 2,410p | |
| Size/Debt | Mkt Cap | Net Cash / Debt(-) | Net Debt / Ebitda | Op Cash/ Ebitda |
| £1,118m | £287m | - | 203% |
| Valuation | Fwd PE (+12mths) | Fwd DY (+12mths) | FCF yld (+12mths) | CAPE |
| 12 | 3.8% | - | 29.6 | |
| Quality/ Growth | EBIT Margin | ROCE | 5yr Sales CAGR | 5yr EPS CAGR |
| 3.0% | 12.8% | 4.9% | 15.8% | |
| Forecasts/ Momentum | Fwd EPS grth NTM | Fwd EPS grth STM | 3-mth Mom | 3-mth Fwd EPS change% |
| -1% | - | -3.4% | 2.3% |
| Year End 31 Dec | Sales | Pre-tax profit | EPS | DPS |
| 2018 | £2.97bn | £81.5m | 142p | 52p |
| 2019 | £3.07bn | £90.3m | 156p | 59p |
| 2020 | £3.03bn | £63.3m | 107p | 61p |
| f'cst 2021 | £3.29bn | £127m | 221p | 87p |
| f'cst 2022 | £3.25bn | £120m | 206p | 92p |
| Source: FactSet, adjusted PTP and EPS figures | ||||
| NTM = Next 12 months | ||||
| STM = Second 12 months (ie, one year from now) | ||||
From a casual glance at Morgan Sindall’s fundamental data it would be easy to conclude we were looking at a storming bargain. No wonder the greedy little Have It All stock screen is all over it.
The company boasts a very attractive five-year compound annual sales growth rate of 5 per cent and almost 16 per cent for underlying EPS. It generates a respectable return on capital employed (ROCE) of 13 per cent. It has a balance sheet brimming with net cash worth £287m at the last count, or £337m ignoring lease liabilities. Forecast growth this year looks exciting, and brokers have recently been upgrading their expectations. And we get all this for a low double-digit forward price/earnings ratio with a near 4 per cent forecast dividend yield thrown in to boot.
But as is sadly so often the case with investing, if we dig a bit deeper we start to see reasons for the market’s reticence. But keep digging, and we also see a management that appears to be intelligently addressing the inherent risks associated with the business.
Let’s start with the reasons to be wary. To put it succinctly, Morgan Sindall is extremely sensitive to conditions in its end markets. In financial jargon, it is both highly cyclical and very operationally geared.

Risky business
The company is involved in a range of building activities. Its largest business is construction and infrastructure (54 per cent of 2020 sales and 41 per cent of operating profit). The second biggest is its more profitable fit-out division (23 per cent of sales and 37 per cent of profit).
The company also does property development, especially building affordable housing. This happens through its partnership housing (14 per cent sales and 18 per cent profit) and urban regeneration (4 per cent sales and 11 per cent profit) operations. These divisions often work in partnership with local government and housing associations and frequently operate through joint ventures.
Finally, Morgan Sindall makes a little bit of money from property management though its property services arm (4 per cent of sales and 1 per cent of profit).
A common strand running through its businesses is that margins are very low and working capital requirements are very large. Working capital is the cash a company has tied up in day-to-day functioning. The cash needed to grease the wheels.
Using traditional balance sheet ratios which measure working capital items against sales, the level of risk is relatively easy to miss. But if we compare working capital items with operating profit, the risk becomes clear. It's the low-margins the company achieves on sales that amps up the risk. Case in point, at the end of 2020, the company’s inventory – land, part complete properties, building materials, etc – stood at over four times the year’s operating profits. Meanwhile, the amount of reported revenue yet to be collected – so-called debtors – represented almost six times profit. Meanwhile, money owed to suppliers and services owed to customers – payables in accounting jargon – was also nearly six times profit.
What this tells us is that Morgan Sindall is involved in a huge working-capital and cash-management balancing act. Skilfully offsetting the amounts it owes with amounts owing is key to determining the return the company makes on its invested capital. It also means it does not take a big negative change in the value of working capital items for a huge dent to be put into profit.
In particular, the revenues it reports require significant amounts of estimation to assess on how far it has progressed with large, complex client contracts. Much of the revenue is not even invoiced when it is reported. Meanwhile, of the three exceptional charges the company has reported over the past 15 years (£47m in 2015, £15m in 2013, £10m in 2012), the two larger hits have been the result of contracts going bad and previously reported revenues disappearing in a puff of smoke.
Cheer up!
But here is where things get a bit cheerier. For investors who are familiar with the plight of construction and outsourcing companies over the last 15 years, Morgan Sindall’s record for exceptional items does not actually look at all bad. What’s more, the biggest hit, the £47m in 2015, related to contracts it acquired from Amey rather than contracts it put together itself.
Indeed, Morgan Sindall makes a point about the strength of its bidding and contract management process. True, all companies in this game tend to make the same noises on this subject. But the relatively clean sheet on exceptional items is an encouraging sign. So too is the fact that a lot of the contracts the company signs are with customers it knows well from having done business with them before.
But perhaps the biggest comfort for investors is the group’s strong net cash position. Seasonal fluctuations means this is best measured as average daily net cash (£294m at the last count) rather than the balance sheet figure. Cash puts the company in a good position to absorb any shocks related to those hefty working capital items. But it also has far deeper strategic significance. It provides the security needed to allow the company to take a long-term view on the contracts and avoid chasing work at any price. It also attracts better clients who want the assurance of doing business with a well-financed building firm. This is a major consideration following the collapse of Carillion and others.
The cash position also means Morgan Sindall can ingratiate itself with suppliers by paying invoices relatively quickly in an industry that has a reputation for sharp practice. The benefit of this has recently been reflected in the company so far reporting little disruption or margin pressure from supply chain issues in the construction sector.
As for end markets, the company’s strategy of looking for work in regulated industries, the public sector and commercial sector helps balance the cyclical risks. However, at the moment end markets look like a source of opportunity rather than pain. At the half-year stage the order book stood at a very healthy £8.3bn. Meanwhile, broker forecasts have been subject to no less than four hefty upgrades this year. Predicted earnings for the coming 12 months are 45 per cent higher than forecasts for the same period a year ago.
Progress is also coming from operational improvements. The company’s strategy is to channel cash from the construction and fit-out businesses into the partnership housing and urban regeneration divisions. These two divisions are tapping into strong structural growth trends, particularly those connected to the undersupply of affordable housing. At the same time, the company is seeking to take both divisions' ROCEs to 20 per cent from – as of the half-year stage – 17 per cent and 14 per cent, respectively. Importantly, there is momentum towards the goal in both businesses.

Pay up?
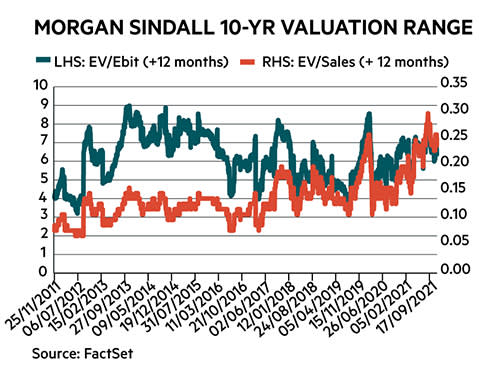
Given the strong cash position, which has been improving fast over recent years, it makes sense to consider Morgan Sindall’s valuation on the basis of enterprise value (EV). EV adds debt to market capitalisation and subtracts cash to give investors a more holistic perspective. Based on EV to forecast operating profits (EV/Ebit) for the next 12 months, Morgan Sindall’s valuation is only around the midpoint of its 10-year range. This in part reflects a view that the post-Covid recovery represents an exceptional period for the group. Indeed, after forecasts for a 107 per cent leap in EPS this year (up 42 per cent on pre-Covid levels, too), earnings are currently expected to bob back a bit in 2022. However, the unexceptional EV/Ebit rating also suggests further good news should be met with further share price rises.
The valuation story is different based on EV to forecast sales (EV/Sales). On this measure the company is close to the most expensive for over the last 10 years. This reflects the fact that while margins are slim, by Morgan Sindall’s own standards it is currently very profitable.
If higher margins are a reflection that good management has created a better company, then a high EV/Sales ratio is nothing to fear and the valuation based on EV/Ebit should prove an opportunity. Indeed, as we’ve seen, there are credible reasons to think that a strong balance sheet and good bidding practice is what’s driving improvements. But going back to those risks outlined at the start, cyclical companies tend to get more profitable when times are good. Times are currently good for Morgan Sindall. For all the things to like about the way the company is run, the danger is of a reversal in end-markets and margins compounded by the unavoidable balance sheet risk.
SEVEN SHARES THAT HAVE IT ALL!
| TESTS FAILED | Name | TIDM | Mkt Cap | Net Cash / Debt(-)* | Price | Fwd PE (+12mths) | Fwd DY (+12mths) | FCF yld (+12mths) | EBIT Margin | ROCE | 5yr Sales CAGR | 5yr EPS CAGR | Fwd EPS grth NTM | Fwd EPS grth STM | 3-mth Mom | 3-mth Fwd EPS change% |
| - | Polymetal Int | POLY | £6,348m | -£1,347m | 1,341p | 7 | 9.1% | 11.9% | 50.5% | 41.1% | 18.8% | 39.5% | 13% | -4% | -12.2% | 2.2% |
| Fwd EPS grth | BHP | BHP | £42,579m | -£4,151m | 2,016p | 9 | 8.7% | 11.0% | 54.0% | 43.2% | 16.7% | - | -7% | -21% | -9.8% | -17.1% |
| FCF yld | Ferrexpo | FXPO | £1,699m | £154m | 289p | 4 | 13.9% | - | 57.0% | 42.9% | 16.1% | 87.0% | -46% | -14% | -23.9% | -41.2% |
| PE, FCF yld, DPS grth, | SSE | SSE | £16,950m | -£9,280m | 1,591p | 17 | 5.4% | -0.7% | 13.5% | 5.9% | -25.0% | 36.5% | 11% | 5% | -3.7% | -1.8% |
| FCF yld, DY, Hist. EPS grth | Morgan Sindall | MGNS | £1,118m | £287m | 2,410p | 12 | 3.8% | - | 3.0% | 12.8% | 4.9% | - | -1% | 3% | -3.4% | 2.3% |
| PE, FCF yld, Fwd EPS grth | Admiral | ADM | £8,831m | -£268m | 2,948p | 19 | 6.1% | - | - | - | 7.5% | 10.8% | -26% | -4% | -20.1% | -13.2% |
| PE, DY, FCF grth | Hilton Food | HFG | £952m | -£372m | 1,156p | 18 | 2.5% | 7.4% | 2.3% | 10.0% | 20.4% | 12.0% | 8% | 7% | 0.2% | 3.4% |
| source: FactSet | ||||||||||||||||
| * FX converted to £ | ||||||||||||||||
| NTM = Next Twelve Months | ||||||||||||||||
| STM = Second Twelve Months (i.e. one year from now) | ||||||||||||||||


