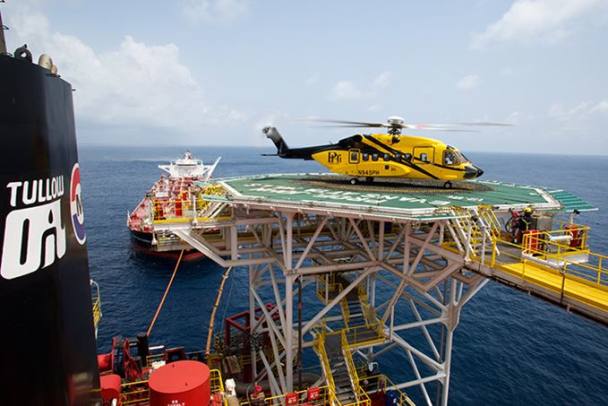
Tullow Oil’s (TLW) value has all but collapsed, with the bulk of the damage done in December when it dropped 2020-2023 guidance and parted ways with its chief executive and exploration boss. The oil price crash has now made its recovery much harder.
The company has said there is “material uncertainty” over its ability to stay above water because a planned $1bn ($790m) in asset sales have just become trickier. Tullow said if its strategy to raise cash through offloading assets is unworkable at current prices, its twice-yearly debt re-determination at the end of March could be derailed.
The company does have “sufficient liquidity” to operate for 12 months if oil stays at $30 per barrel (bbl) and it misses production guidance of 70,000-80,000 barrels of oil per day (bopd). Alongside the asset sales, the company also has plans to cut 35 per cent of its workforce. Tullow won’t feel the full brunt of low oil prices in 2020 because of its hedging programme. Almost two thirds of this year’s sales revenue is hedged with a floor of $57 a barrel, and 40 per cent of 2021 revenue has a floor of $53 a barrel.
The terrible run in 2019, which saw a promising Guyana discovery turn sour over oil quality concerns, alongside production issues in Ghana – has now been crystallised with a writedown of $2bn, including $1.2bn in exploration costs and almost $800m in property, plant and equipment impairments.
Underlying performance also declined, with lower oil prices and production knocking 14 per cent off free cash flow, which was $355m.
Consensus forecasts compiled by Bloomberg put 2020 adjusted EPS at 60ȼ, flat on 2019.
| TULLOW OIL (TLW) | ||||
| ORD PRICE: | 13.28p | MARKET VALUE: | £187m | |
| TOUCH: | 13.28-13.36p | 12-MONTH HIGH: | 255p | LOW: 10p |
| DIVIDEND YIELD: | 14.2% | PE RATIO: | NA | |
| NET ASSET VALUE: | 70ȼ* | NET DEBT: | $4.2bn** | |
| Year to 31 Dec | Turnover ($bn) | Pre-tax profit ($bn) | Earnings per share (ȼ) | Dividend per share (ȼ) |
| 2015 | 1.61 | -1.30 | -97.0 | nil |
| 2016 | 1.27 | -0.91 | -55.8 | nil |
| 2017 | 1.72 | -0.29 | -13.7 | nil |
| 2018 | 1.86 | 0.26 | 6.10 | 4.8 |
| 2019 | 1.68 | -1.65 | -121 | 2.35 |
| % change | -10 | - | - | -51 |
| Ex-div: | na | |||
| Payment: | na | |||
| £1=$1.25 *Includes $1.8bn in intangible assets, or 125ȼ per share **Includes $1.4bn in lease liabilities. | ||||


