

Over recent years, value investors have been forced to become ever more wary about the risk of buying into value traps. These are shares that look cheap on the surface but turn out not to be because of a long-term deterioration in the earnings power of the underlying business. Often buying into a value trap will culminate in all value being wiped out.
Part of the reason for the proliferation of value traps over recent years is that innovative companies have used technology to disrupt industry incumbents and especially weaker companies. The impact of online competition on bricks-and-mortar retailers and their landlords is a case in point. Meanwhile, other 'value trap' companies have simply come unstuck due to the normal machinations of the business cycle. Long periods of supportive trading conditions can encourage oversupply in industries, which in turn leads to businesses taking on unprofitable work and the eventual failure of weaker players until balance is restored. The woes of the construction and support services sectors over recent years can arguably be lumped into this camp.
All in all, it has become increasingly risky for investors to just buy 'cheap' shares with fingers crossed. In fact, just buying 'cheap' shares is always a haphazard strategy, which is why at the end of the last century US accountancy professor Joseph Piotroski attempted to come up with a way of identifying shares with low valuations that were seeing their fortunes improve – in contrast to the ever-deteriorating fortunes of 'value trap' companies.
Mr Piotroski concocted an artful web of financial characteristics that together suggest a company is making operational progress without recourse to outside financing. Mr Piotroski’s method relies on the interplay of nine different fundamentals and he considers any company displaying eight or more of these characteristics to have a high 'F-Score'. In his paper 'Value Investing: The Use of Historical Financial Statement Information to Separate Winners from Losers', published in 2000, he found that a long-short strategy based on buying cheap stocks with high F-Scores and selling expensive ones with low scores produced an average annual return of 23 per cent in the 20 years to 1996. That was almost double the return achieved by the S&P 500.
The F-Score is based on the following criteria:
■ Positive profit after tax, excluding exceptional items.
■ Positive cash from operations.
■ Profits after tax excluding exceptional items up on the previous year, which professor Piotroski highlights as being of particular importance as a signal that a company may be in recovery mode and in the process of rerating.
■ Cash from operations higher than profit after tax, excluding exceptional items, which indicates an ability to convert accounting profit into actual cash.
■ Gearing (net debt as a percentage of net assets) down on the preceding year, which suggests that the company has not had to look for external sources of finance.
■ The current ratio (current assets divided by current liabilities) up on the preceding year, which suggests that the company's ability to service upcoming financial obligations is improving.
■ No new shares issued over the past year, which again suggests that the company has not had to look for external sources of finance.
■ Gross margins have risen in the past year.
■ Improving capital turn (turnover as a proportion of net assets), which suggests greater productivity.
When it came to identifying value, Mr Piotroski’s study relied on an old valuation stalwart: the price-to-book ratio (P/BV). As a measure of value, P/BV has been immortalised by the “grandfather of value investing”, Benjamin Graham, as well as seminal research by academics Eugene Fama and Kenneth French. The central rationale behind focusing on the ratio is that book value (BV) gives an indication of the profit-producing assets belonging to a company’s shareholders (book value is also known as shareholder equity or net asset value). At times when the earnings produced by these assets (return on equity) slips, the amount shareholders are willing to pay for a stock relative to BV may well fall, which means a lower P/BV ratio. However, any improvement in return on equity from a low P/BV company can be expected to produce a boost to the valuation multiple applied to BV – in other words, the P in P/BV should rise.
The problem many investors have with P/BV is that reported book value can often become out of touch with the true worth of a company’s assets. Companies are often slow to write asset values down or (in some cases) up. What’s more, many of the most valuable investments that today’s companies make are recorded as expenses rather than being capitalised as assets on the balance sheet. Such expenses, which BV is largely blind to, include things such as advertising, and research and development (R&D), which can be key to providing companies with a competitive edge.
While I run a separate Piotroski screen each year that uses only the traditional P/BV valuation yardstick, the point of this screen is to see how the F-Score fares when used with a wider range of valuation measures. The screen looks for high F-Score stocks that appear 'cheap' (lowest fifth of stocks screened) based on one or more of the following six valuation measures:
■ Dividend yield (DY)
■ Price-earnings ratio based on rolling 12-month forecasts (Fwd NTM PE).
■ P/BV
■ Enterprise value to sales (EV/S): The idea of this valuation measure is similar to the idea of valuing a share against book value. The difference is that in this case sales are taken as the source of a company’s earnings rather than its asset base. Rather than using share price or market cap to construct the ratio, a basic calculation of enterprise value (EV) is used to give a rough idea of the value being put on the whole company. EV is a company’s market cap plus its net debt (or minus net cash). EV can also be adjusted for other debt-like liabilities such as leases and pensions as well as the actual market value of borrowings and average borrowings over the year. However, my screen uses the most basic of methods.
■ Enterprise value to free cash flow (EV/FCF).
■ ZEUS ratio: This measures how cheap or expensive shares are compared with their 10-year valuation history. The valuation is based on the ultimate source of a company's earnings, which is taken to be either sales or book value depending on how asset-centric the underlying business is. For example, the ZEUS ratio for property companies is based on P/BV, but for retailers it is based on EV/S.
■ Genuine value (GV) ratio: This compares a company's ratio of enterprise value to operating profits (EV/Ebit) with expected total return (forecast earnings growth plus dividend yield). This is a bit like the classic price/earnings growth (PEG) ratio popularised in the UK by Jim Slater, but adjusted for net debt/cash and dividends.
This screen tends to produce a lot of results each year, however it has managed to produce some decent outperformance of the market in the five years I’ve run it. Assigning equal weight to each of the three permutations of the screen I run (All Shares, All Small and Aim) the total return from last year’s F-Score Value Hunt was 1.7 per cent compared with a negative 9.1 per cent from the market (taken to be an equal split between the FTSE All-Share, All Small and Aim All-Share). This seems pretty impressive given the dire run that many of my value screens have had this year when the value style seems to have been particularly out of vogue.
2018 performance
| All-Share | Small | Aim | ||||||
| Name | TIDM | Total return (4 Sep 2018 - 22 Aug 2019) | Name | TIDM | Total return (4 Sep 2018 - 22 Aug 2019) | Name | TIDM | Total return (4 Sep 2018 - 22 Aug 2019) |
| Petropavlovsk | POG | 51% | T Clarke | CTO | 36% | Highland Gold Mining | HGM | 77% |
| Centamin | CEY | 40% | nmcn | NMCN | 18% | The Mission Mktg. | TMMG | 53% |
| JD Wetherspoon | JDW | 34% | JKX Oil & Gas | JKX | 17% | Shoe Zone | SHOE | 26% |
| Stock Spirits | STCK | 26% | SCS | SCS | 17% | Ramsdens | RFX | 17% |
| Unite | UTG | 21% | Highcroft Investments | HCFT | -2.9% | FIH Group | FIH | -1.4% |
| Liontrust Asset Man. | LIO | 18% | London Fin.& Inv | LFI | -6.8% | Holders Technology | HDT | -4.5% |
| Man Group | EMG | 3.6% | - | - | - | Pittard | PTD | -15% |
| Kenmare Res. | KMR | 0.0% | - | - | - | Advfn | AFN | -18% |
| Ferguson | FERG | -0.3% | - | - | - | Wentworth Resources | WEN | -24% |
| Phoenix Group | PHNX | -0.9% | - | - | - | Mulberry | MUL | -26% |
| Vodafone | VOD | -4.4% | - | - | - | Strategic Minerals | SML | -31% |
| Countryside Properties | CSP | -6.3% | - | - | - | Swallowfield | SWL | -36% |
| Macfarlane | MACF | -6.6% | - | - | - | STM Group | STM | -38% |
| Cranswick | CWK | -17% | - | - | - | Zambeef | ZAM | -48% |
| Smurfit Kappa | SKG | -22% | - | - | - | Webis | WEB | -58% |
| Vesuvius | VSVS | -22% | - | - | - | - | - | - |
| Babcock International | BAB | -25% | - | - | - | - | - | - |
| Easyjet | EZJ | -36% | - | - | - | - | - | - |
| Just | JUST | -52% | - | - | - | - | - | - |
| FTSE All Share | - | -1.4% | FTSE All Share | - | -1.4% | FTSE Aim All-Share | - | -20% |
| F-Score All Share | - | 0.1% | F-Score Small Cap | - | 13% | F-Score Aim | - | -8.5% |
Source: Thomson Datastream
The cumulative total return from the screen in the five years I’ve followed it now stands at 69.7 per cent, compared with 30.2 per cent from the market. While the screens run in this column are regarded as a source of ideas for further research rather than off-the-shelf portfolios, if I factor in a 1.5 per cent annual charge to represent real world dealing costs, the total return drops to 57.4 per cent. Charts for the overall screen return and for the performance in individual markets can be seen below.
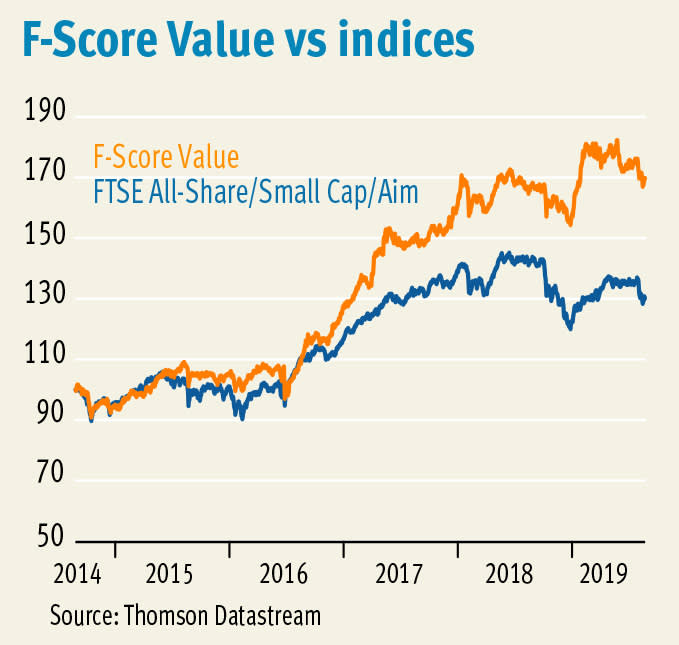
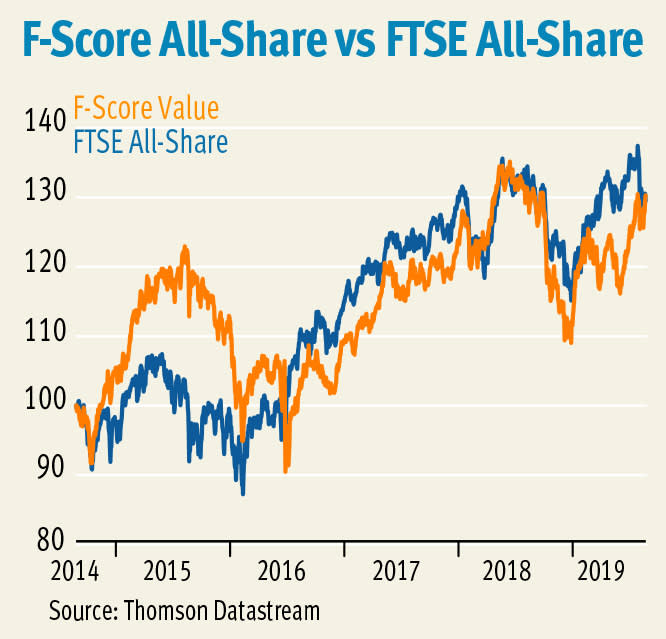
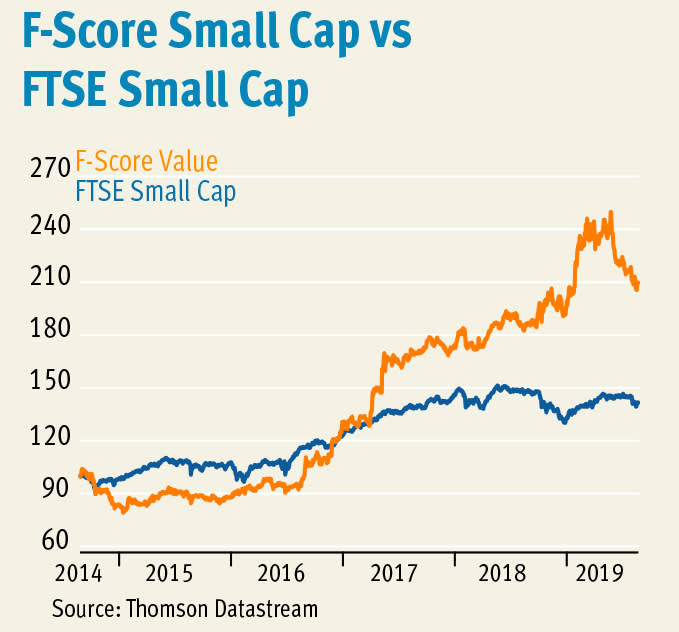

Because larger companies tend to command higher valuations to reflect higher perceived quality, I conduct this screen separately on three indices: the FTSE All-Share, All Small and Aim. The screen tends to throw off a fair few results and this year has offered up 49 potential ideas for further research. The table below provides brief sector descriptions along with a range of fundamentals.
We're all going on an F-Score value hunt
| Index | Name | TIDM | Sector Detail | F Score | Cheap | Mkt Cap | P | Fwd NTM PE | DY | ZEUS | EV/EBIT | EV/FCF | EV/Sales | PEG | GV Ratio | P/BV | FY EPS gr+1 | FY EPS gr+2 | 3-mth Momentum | Net Cash/Debt(-) |
| AIM | Regal Petroleum | AIM:RPT | Oil, Gas and Consumable Fuels | 9 | / EV/FCF / | £105m | 33p | - | - | - | 3.0 | 4.2 | 1.2 | - | - | 1.2 | - | - | -17% | £42m |
| AIM | MS International | AIM:MSI | Aerospace and Defense | 9 | / GV /EV/FCF /EV/S / | £34m | 204p | - | 4.0% | -0.7 | 1.8 | 1.3 | 0.1 | - | 0.4 | 0.9 | - | - | -6.0% | £23m |
| AIM | Titon | AIM:TON | Building Products | 9 | / EV/FCF /EV/S / | £15m | 135p | 10 | 3.5% | - | 4.4 | 4.2 | 0.4 | - | - | 1.0 | -26% | 14% | -21% | £3.8m |
| AIM | Coral Products | AIM:CRU | Containers and Packaging | 9 | / PBV /DY /EV/FCF /EV/S / | £7m | 8p | - | 6.3% | - | 43 | 6.1 | 0.5 | - | 6.9 | 0.5 | - | - | 0.0% | -£8.2m |
| AIM | Team17 | AIM:TM17 | Entertainment | 8 | / ZEUS / | £341m | 264p | 27 | - | -1.6 | 25 | 30 | 7.4 | 3.1 | 1.8 | 5.4 | 19% | 8.0% | 1.7% | £24m |
| AIM | Strix | AIM:KETL | Electronic Equipment, Instruments and Components | 8 | / ZEUS / | £307m | 162p | 11 | 4.3% | -0.9 | 11 | 16 | 3.6 | 7.8 | 1.8 | - | -4.4% | 8.4% | -0.4% | -£27m |
| AIM | Boku | AIM:BOKU | IT Services | 8 | / ZEUS / | £267m | 107p | 118 | - | -1.2 | - | 15 | 6.9 | - | - | 11 | 10% | 182% | -20% | £23m |
| AIM | Bushveld Minerals | AIM:BMN | Metals and Mining | 8 | / GV /EV/FCF / | £235m | 21p | 5.8 | - | 1.2 | 3.0 | 4.8 | 1.2 | 0.8 | 0.3 | 2.3 | 34% | -8.0% | -29% | £35m |
| AIM | Amerisur Resources | AIM:AMER | Oil, Gas and Consumable Fuels | 8 | / GV / | £211m | 17p | 11 | - | 3.6 | 19 | 141 | 1.7 | 0.5 | 0.1 | 1.3 | 1466% | -54% | 38% | £27m |
| AIM | Mattioli Woods | AIM:MTW | Capital Markets | 8 | / ZEUS / | £205m | 765p | 19 | 2.3% | -0.8 | 20 | 26 | 3.2 | 2.7 | 1.7 | - | 6.9% | 11% | -5.9% | £17m |
| AIM | Anglo Asian Mining | AIM:AAZ | Metals and Mining | 8 | / EV/FCF / | £152m | 133p | 15 | 4.1% | -0.7 | 6.9 | 5.7 | 1.6 | - | - | 2.0 | -22% | -20% | 47% | £4.8m |
| AIM | Character Group | AIM:CCT | Leisure Products | 8 | / GV /DY / | £112m | 523p | 11 | 4.8% | - | 7.9 | 16 | 0.8 | 1.3 | 0.6 | 3.3 | 6.6% | 11% | -7.0% | £20m |
| AIM | Real Estate Investors | AIM:RLE | Real Estate Management and Development | 8 | / DY / | £100m | 54p | 13 | 6.6% | - | 18 | 25 | 12 | 2.8 | 1.6 | 0.8 | 4.4% | 4.3% | -0.5% | -£91m |
| AIM | Augean | AIM:AUG | Commercial Services and Supplies | 8 | / GV /EV/FCF / | £95m | 92p | 7.6 | - | - | 6.3 | 2.8 | 0.8 | 0.5 | 0.3 | 1.4 | 43% | -0.1% | -8.7% | £23m |
| AIM | Duke Royalty | AIM:DUKE | Metals and Mining | 8 | / DY / | £94m | 47p | 16 | 5.3% | - | - | - | 16 | - | - | 1.3 | - | - | 1.3% | £36m |
| AIM | Amino Technologies | AIM:AMO | Communications Equipment | 8 | / DY / | £89m | 117p | 11 | 6.3% | -0.5 | 14 | 11 | 0.9 | - | 2.3 | 1.5 | -9.3% | 9.7% | 44% | £15m |
| AIM | Avingtrans | AIM:AVG | Machinery | 8 | / ZEUS / | £70m | 224p | 17 | 1.7% | -1.1 | - | 13 | 0.8 | - | - | 1.0 | 54% | 9.3% | -0.1% | -£7.1m |
| AIM | Elegant Hotels | AIM:EHG | Hotels, Restaurants and Leisure | 8 | / PBV /DY /ZEUS / | £62m | 70p | 6.6 | 5.6% | -1.1 | 11 | 38 | 1.8 | 1.1 | 0.8 | 0.6 | 9.2% | 5.5% | -3.7% | -£53m |
| AIM | Parkmead | AIM:PMG | Oil, Gas and Consumable Fuels | 8 | / PBV /EV/FCF / | £47m | 48p | 37 | - | -0.3 | - | 5.9 | 2.4 | - | - | 0.7 | - | - | -23% | £24m |
| AIM | Property Franchise | AIM:TPFG | Real Estate Management and Development | 8 | / DY / | £42m | 164p | 12 | 5.1% | - | 9.2 | 11 | 3.6 | 4.2 | 1.1 | 2.7 | 0.8% | 5.1% | -7.9% | £2.3m |
| AIM | Billington | AIM:BILN | Construction and Engineering | 8 | / EV/S / | £37m | 306p | 9.0 | 4.2% | -0.1 | 5.9 | 10 | 0.4 | 3.4 | 0.9 | 1.6 | 1.5% | 3.7% | -9.0% | £7.6m |
| AIM | Good Energy | AIM:GOOD | Independent Power and Renewable Electricity Producers | 8 | / GV /EV/FCF /EV/S / | £26m | 160p | 18 | 2.2% | - | 10 | 6.1 | 0.6 | 0.4 | 0.2 | 1.4 | 36% | 34% | 3.2% | -£45m |
| AIM | Hydrogen | AIM:HYDG | Professional Services | 8 | / PBV /GV /EV/FCF /EV/S / | £16m | 49p | 6.1 | 3.1% | - | 4.0 | 2.2 | 0.1 | 0.4 | 0.2 | 0.8 | 25% | 7.6% | -40% | £4.9m |
| AIM | Universe | AIM:UNG | IT Services | 8 | / PBV /EV/S / | £14m | 5p | 14 | - | - | 13 | 51 | 0.6 | 0.7 | 0.6 | 0.5 | 21% | 21% | 6.7% | £1.9m |
| AIM | Croma Security Solutions | AIM:CSSG | Electronic Equipment, Instruments and Components | 8 | / EV/S / | £12m | 82p | - | 2.1% | 1.5 | 5.2 | 19 | 0.3 | - | 2.5 | 1.1 | - | - | -17% | £1.7m |
| AIM | Tandem | AIM:TND | Leisure Products | 8 | / PBV /EV/S / | £9m | 188p | - | 2.3% | -0.2 | 4.3 | 8.4 | 0.3 | - | 1.9 | 0.8 | - | - | -1.3% | £0.1m |
| AIM | Biome Technologies | AIM:BIOM | Chemicals | 8 | / EV/S / | £8m | 350p | - | - | 0.8 | 90 | 30 | 0.6 | - | - | 2.2 | - | - | 4.5% | £2.6m |
| AIM | Immedia | AIM:IME | Media | 8 | / EV/S / | £3m | 19p | 16 | - | - | 20 | 7.9 | 0.5 | 1.3 | 1.6 | 12 | 4.6% | 20% | -22% | £0.3m |
| ALL SHARE | Northgate | LSE:NTG | Road and Rail | 9 | / PBV /EV/FCF / | £427m | 324p | 8.3 | 5.6% | -1.0 | 11 | 4.3 | 1.2 | 1.7 | 1.1 | 0.8 | 2.2% | 7.9% | -1.6% | -£438m |
| ALL SHARE | Barratt Developments | LSE:BDEV | Household Durables | 9 | / GV /EV/FCF / | £6.3bn | 623p | 8.8 | 4.4% | 0.7 | 6.7 | 8.2 | 1.2 | 3.1 | 0.9 | 1.4 | 6.7% | -0.5% | 4.7% | £379m |
| ALL SHARE | Hunting | LSE:HTG | Energy Equipment and Services | 8 | / PBV /GV /EV/S /ZEUS / | £726m | 438p | 11 | 1.6% | -1.2 | 12 | 43 | 0.8 | 0.7 | 0.7 | 0.8 | 5.5% | 23% | -22% | £48m |
| ALL SHARE | NCC | LSE:NCC | IT Services | 8 | / ZEUS / | £498m | 179p | 17 | 2.6% | -1.4 | 22 | 25 | 2.1 | 2.2 | 1.1 | 2.4 | 14% | 17% | 5.1% | -£20m |
| ALL SHARE | Halfords | LSE:HFD | Specialty Retail | 8 | / PBV /GV /DY /EV/FCF /EV/S /ZEUS / | £343m | 174p | 7.6 | 11% | -2.2 | 6.8 | 11 | 0.4 | - | 0.8 | 0.8 | -6.0% | 1.8% | -27% | -£82m |
| ALL SHARE | EnQuest | LSE:ENQ | Oil, Gas and Consumable Fuels | 8 | / PBV /EV/FCF / | £306m | 19p | 2.2 | - | -0.2 | 8.2 | 6.2 | 1.7 | - | - | 0.4 | 1.9% | -5.3% | -11% | -£2.0bn |
| ALL SHARE | Pendragon | LSE:PDG | Specialty Retail | 8 | / PBV /DY /EV/S /ZEUS / | £148m | 11p | - | 14% | -2.7 | 4.8 | - | 0.1 | - | - | 0.4 | - | - | -54% | -£128m |
| ALL SHARE | Macfarlane | LSE:MACF | Trading Companies and Distributors | 8 | / GV /EV/S / | £144m | 92p | 12 | 2.5% | 1.5 | 13 | 19 | 0.7 | 0.7 | 0.5 | 2.3 | 37% | 8.6% | -13% | -£45m |
| ALL SHARE | Topps Tiles | LSE:TPT | Specialty Retail | 8 | / EV/S /ZEUS / | £129m | 66p | 10 | 5.2% | -1.2 | 10 | 14 | 0.7 | 5.2 | 1.4 | 4.9 | -2.8% | 8.1% | -11% | -£18m |
| ALL SHARE | Luceco | LSE:LUCE | Electrical Equipment | 8 | / GV /EV/S / | £115m | 74p | 10 | 0.8% | - | 19 | 19 | 0.9 | 1.2 | 0.3 | 2.9 | 146% | -4.0% | -14% | -£32m |
| ALL SHARE | Ferguson | LSE:FERG | Trading Companies and Distributors | 8 | / EV/FCF /EV/S / | £14bn | 5,916p | 14 | 2.5% | 1.2 | 14 | 12 | 0.7 | 2.8 | 1.3 | 4.2 | 13% | 2.5% | 12% | -£1.4bn |
| ALL SHARE | Phoenix | LSE:PHNX | Insurance | 8 | / PBV /GV /DY /EV/FCF /EV/S / | £4.8bn | 660p | 8.3 | 7.1% | -0.1 | 6.4 | 0.0 | 0.2 | 0.5 | 0.2 | 0.9 | 71% | -17% | -6.2% | £3.0bn |
| ALL SHARE | RHI Magnesita | LSE:RHIM | Construction Materials | 8 | / GV /EV/FCF /EV/S / | £2.1bn | 4,308p | 7.5 | 4.2% | - | 7.7 | 8.0 | 0.9 | 1.3 | 0.5 | 2.8 | 14% | 6.4% | -8.1% | -£599m |
| ALL SHARE | Grafton | LSE:GFTU | Trading Companies and Distributors | 8 | / EV/S / | £1.6bn | 688p | 10 | 2.6% | -0.6 | 9.1 | 25 | 0.6 | 13 | 2.7 | 1.3 | -5.8% | 7.9% | -21% | -£53m |
| ALL SHARE | Mitchells & Butlers | LSE:MAB | Hotels, Restaurants and Leisure | 8 | / PBV /ZEUS / | £1.5bn | 350p | 9.4 | - | -1.0 | 12 | 42 | 1.5 | 2.5 | 2.1 | 0.8 | 7.3% | 3.8% | 36% | -£1.9bn |
| ALL SHARE | Bovis Homes | LSE:BVS | Household Durables | 8 | / GV /DY / | £1.4bn | 1,028p | 10 | 5.5% | 0.5 | 7.2 | 110 | 1.2 | 1.2 | 0.5 | 1.3 | 6.2% | 11% | -1.1% | £127m |
| ALL SHARE | Sports Direct | LSE:SPD | Specialty Retail | 8 | / EV/S /ZEUS / | £1.2bn | 239p | 12 | - | -1.3 | 8.7 | - | 0.4 | 2.5 | 2.0 | 1.0 | 16% | -5.9% | -16% | -£379m |
| SMALL | Capital Drilling | LSE:CAPD | Energy Equipment and Services | 8 | / GV /EV/FCF /EV/S / | £76m | 56p | 10 | 3.0% | -0.4 | 5.7 | 6.6 | 0.5 | 0.8 | 0.3 | 1.3 | 22% | 8.4% | 9.0% | £13m |
| SMALL | Record | LSE:REC | Capital Markets | 8 | / DY /EV/FCF / | £61m | 31p | 13 | 7.4% | -0.4 | 4.7 | 6.3 | 1.5 | - | - | - | -26% | 1.6% | 3.4% | £24m |
| SMALL | Works.co.uk | LSE:WRKS | Specialty Retail | 8 | / EV/S / | £56m | 90p | 10 | 4.0% | - | 8.7 | - | 0.2 | 6.5 | 0.8 | 1.3 | 0.3% | 14% | -6.6% | £3.1m |
| SMALL | nmcn | LSE:NMCN | Construction and Engineering | 8 | / EV/FCF /EV/S / | £54m | 530p | 9.0 | 4.0% | 0.3 | 5.1 | 2.8 | 0.1 | 14 | 1.1 | 2.9 | -3.5% | 5.4% | -8.5% | £16m |
Source: S&P CapitalIQ


