

Momentum can be a fickle friend. While tomes of academic research provide strong evidence that momentum strategies (buying shares that have been rising strongly in hope of more of the same) outperform over the long term, there are frequently big bumps along the road. What’s more, the spectral nature of 'momentum' can make it a tricky strategy for investors to keep faith with during bad times – chasing momentum is ultimately chasing market sentiment, as reflected in share price action, whereas most other investment strategies tend to offer the comfort of being anchored to an analysis of company fundamentals.
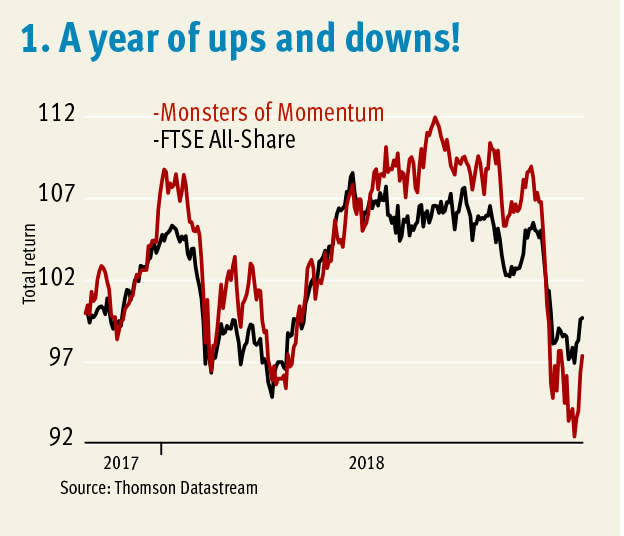
As is evident from its name, my Monsters of Momentum screen pays attention only to share price action and couldn’t give a stuff about company fundamentals. Momentum strategies have experienced a nasty jolt in October. Up until this point, there was a general view that momentum stocks had driven the majority of index gains over the year. The stocks selected by my screen 12 months ago certainly captured the rollercoaster ride momentum has been on, with major downward lurches during the January market wobbles as well as the more recent bout of nerves.
The overall performance for the year – a 2.6 per cent negative total return compared with a negative 0.3 per cent from the FTSE All-Share – does not really do the drama of the year justice, and the one-year performance chart below gives a better flavour of the hijinks than the table of stock returns.
How last year's Monsters performed
| Company | TIDM | Total return (13 Nov 2017 - 1 Nov 2018) |
| Aveva | AVV | 66% |
| Games Workshop | GAW | 60% |
| NMC Health | NMC | 24% |
| Vedanta | VED | 9.1% |
| MJ Gleeson | GLE | 1.0% |
| Independent Inv Trst | IIT | -12% |
| Man Group | EMG | -13% |
| Renishaw | RSW | -17% |
| Just Eat | JE. | -18% |
| Sophos | SOPH | -21% |
| XP Power | XPP | -27% |
| PureCircle | PURE | -34% |
| SuperDry | SDRY | -53% |
| FTSE All Share | - | -0.3% |
| Monsters of Mom | - | -2.6% |
Source: Thomson Datastream
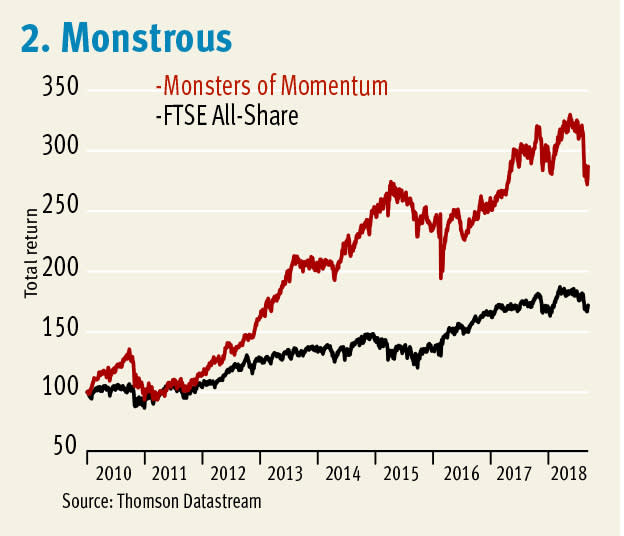
The long-term performance of the screen remains good, boasting a 186 per cent total return over the eight years I’ve run it, compared with 72 per cent from the FTSE All-Share over the same period. If I try to inject a sense of reality into those numbers by factoring in a notional 1.5 per cent annual dealing charge to reflect the reshuffling of the portfolio (the screens are run with the assumption that they are primarily of interest as a means of idea generation rather than off-the-shelf portfolios) the total return drops to 154 per cent.
There are some grounds to think the market may be due a change of pace, not least due to the trend towards monetary tightening by central banks around the world, and in particular the Federal Reserve. However, should there be change in the air – a switch from the dominance of growth stocks to outperformance by value stocks is a popular idea – then momentum should eventually pick up as long as any new trend is sustained. Indeed, this is illustrated by the fact that the Monsters of Momentum picks from this year look a dowdy bunch, consisting of many utility stocks, infrastructure and property plays – a number of which are investment funds. Given the screen’s focus on very recent momentum trends as well as longer-term strength, it seems to have picked up on last month’s ructions. Only time will tell if this is of value. Indeed, should the market regain its old form following October’s drops, then the 12-month results from this year’s picks could well look poor.
The screen’s full criteria are:
■ Price momentum: A share price rise in the top 10 per cent of shares screened over the past three months, in the top 25 per cent over six months, and in the top 50 per cent over a year.
■ Trend: The 10-day moving average must be above the 30-day, which in turn must be above the 100-day.
■ Earnings growth: Average forecast earnings growth for the next two financial years must be among the top quarter of all stocks screened.
■ Volume: Average daily volumes over the past three months must be above the level from a year ago.
The screen is conducted on all constituents of the FTSE All-Share. No stock passed all the screen’s tests, but 16 qualified based on a weakened criteria that allowed them to fail one of the tests (Energean was allowed to fail the one-year momentum test and the trading volume test due to its share being listed less than a year). The results are listed in the table below and the downloadable version of the table (see link) provides additional fundamental data on the qualifying shares. I’ve also provided short write-ups of the two stocks from the screen that boast the strongest three-month momentum.
16 Monsters of Momentum
| Name | TIDM | Mkt Cap | Price | Fwd NTM PE | DY | Fwd EPS grth FY+1 | Fwd EPS grth FY+2 | Fwd EPS chg 3 mths | 3-mth Momentum | Net Cash/Debt(-) |
| Energean Oil & Gas | ENOG | £937m | 613p | 43 | - | 46% | 75% | 9705% | 19% | $176m |
| Telecom Plus | TEP | £957m | 1,230p | 21 | 4.1% | 8.7% | 13% | -0.9% | 18% | -£11m |
| AG Barr | BAG | £863m | 763p | 24 | 2.0% | 1.9% | 9.5% | -1.9% | 12% | £4m |
| Drax | DRX | £1.6bn | 397p | 22 | 3.1% | 1475% | -31% | 7.7% | 11% | -£366m |
| BH Macro | BHMG | £384m | 2,360p | - | - | - | - | - | 9.5% | $1m |
| LXI REIT | LXI | £414m | 118p | - | 3.4% | - | - | - | 8.8% | -£63m |
| Tate & Lyle | TATE | £3.1bn | 677p | 13 | 4.2% | 0.7% | 2.0% | 1.1% | 8.4% | -£356m |
| PureTech Health | PRTC | £461m | 163p | - | - | - | - | - | 7.5% | $188m |
| SQN Asset Finance Income | SQNX | £341m | 97p | - | - | - | - | - | 6.6% | - |
| Civitas Social Housing | CSH | £387m | 111p | 22 | 4.5% | - | - | - | 5.7% | £159m |
| Schroder European Real Estate Investment Trust | SERE | £154m | 116p | - | 5.7% | - | - | - | 4.1% | -€22m |
| Renewables Infrastructure Group | TRIG | £1.3bn | 114p | 8 | 5.7% | 42% | -25% | - | 4.0% | £15m |
| Greencoat UK Wind | UKW | £1.5bn | 130p | 8 | 5.2% | 120% | -14% | - | 3.9% | -£392m |
| Bluefield Solar Income Fund | BSIF | £462m | 125p | 41 | 5.9% | -69% | -44% | - | 3.7% | £1m |
| SL Private Equity | SLPE | £529m | 344p | - | 3.6% | - | - | - | 3.1% | £68m |
| HgCapital Trust | HGT | £730m | 1,955p | - | 2.4% | - | - | - | 2.9% | £154m |
Source: S&P CapitalIQ
Energean Oil & Gas
Energean Oil & Gas (ENOG) has had a storming start to its life as a listed company, which began in March this year when it raised $460m (£354m) by floating shares at 455p. The strength of the oil price this year – at least until the recent sell-off – has certainly played a part in the strong share price performance, but there are other reasons for the market’s excitement.
Most of the money Energean raised at float will be used to develop a massive offshore gas prospect in Israel. The Karish field, which is central to the company’s investment case, has a vast prospective resource of 7.5 trillion cubic feet. Work will start on firming up estimates of future production early next year, with a well due to be drilled in North Karish at a cost of $25m that will target about a fifth of the resource. The well has been given a near-70 per cent chance of success, which illustrates the confidence the company and consultants have about the area’s geological features. What’s more, the geology of Energean’s Israeli licences is fairly uniform, so a positive result from the first well may give the market an added cause for celebration. As far as exploration goes, Karish appears to be a relatively low-risk project.
There are reasons to be optimistic about potential demand for gas from Karish, too. Israel’s energy sector is in the process of transferring to gas-fuelled power generation. This means there should be a ready and growing source of customers, and the group has already put in place contracts for supply that should mean profitability increases with production from Karish. What’s more, a current monopoly of gas supply means Israeli authorities are keen to see a new competitor emerge in its market. There is also the potential to sell gas to other countries in the region, particularly Jordon.
But Energean has producing assets as well as exploration assets, and these have been making a significant contribution to momentum since float. The group’s late-life oil and gas production assets in Greece have performed better than expected. What’s more, the pressures being recorded from its Greek fields suggest there may be potential to extend production life. The cash juiced from legacy assets will help fund the development of Karish, and while a lot of production sales are hedged, the higher oil price is helping cash generation. Broker Stifel thinks $100m of cash flow is possible from Greece next year.
Putting a value on speculative resources plays is always tough. Analysts tend to try to estimate 'risked' valuations based on the probability of success, but investors themselves do not experience returns form individual projects based on probabilities but on single outcomes – a drilling failure is a failure whether the probability was low or high. The vagaries of forecasting long-term oil prices and deciding on discount rates also push the exercise of valuing this type of stock towards the realms of sophistry.
Still, there are normally plenty of attempts to calculate the net present value of companies such as Energean. Stifel's best guess is that the group’s core net asset value (NAV) is about 612p, with a further 292p of contingent value and 186p of value that can be attributed to exploration potential. Based on the core and contingent value the broker sets a target price of 904p. Of course, a reversal in the recent ascent of the oil price could change all that, as could a disappointment from Karish or a production hiccup. Still, it seems there are grounds to think there’s value on offer as well as momentum.
Telecom Plus
Telecoms Plus operates a utilities buying club under the Utility Warehouse brand. The business aims to offer club members fair and competitive prices, transparent billing and high service levels. From a consumer perspective, it's rather depressing that the marketing activities prevalent in the utility sector make these simple, decent practices such a solid foundation for an enterprise.
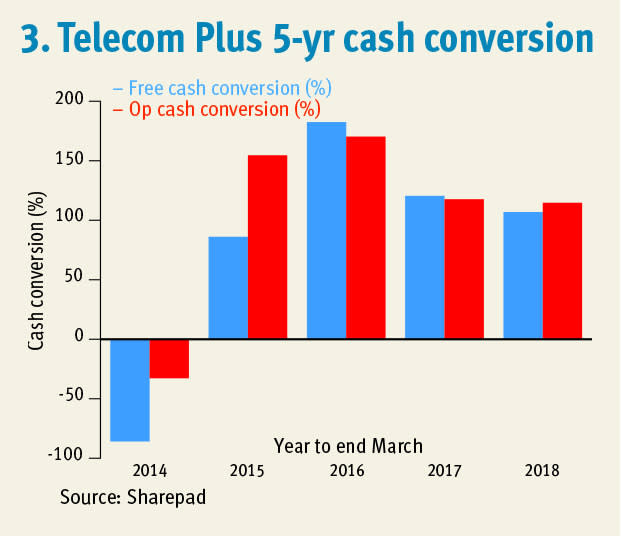
Telecom Plus has a well-earned reputation for having a quality operation that generates good returns and strong cash flows. This can be seen in the charts below, with the drop in cash conversion in 2014 reflecting the establishment of a fateful 20-year energy supply deal with Npower (more on that later).
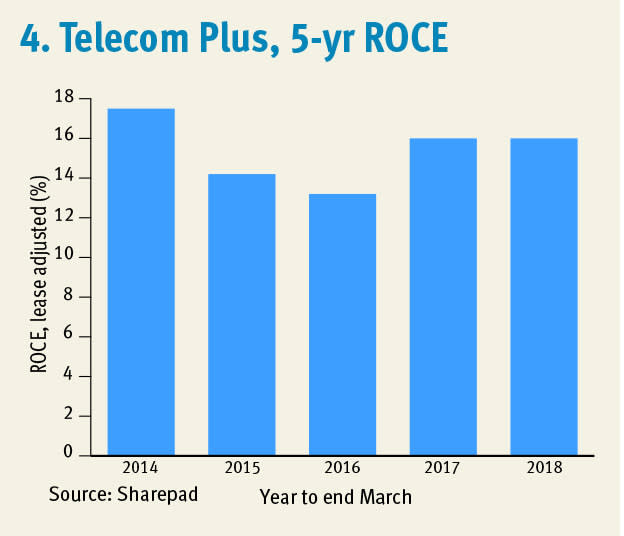
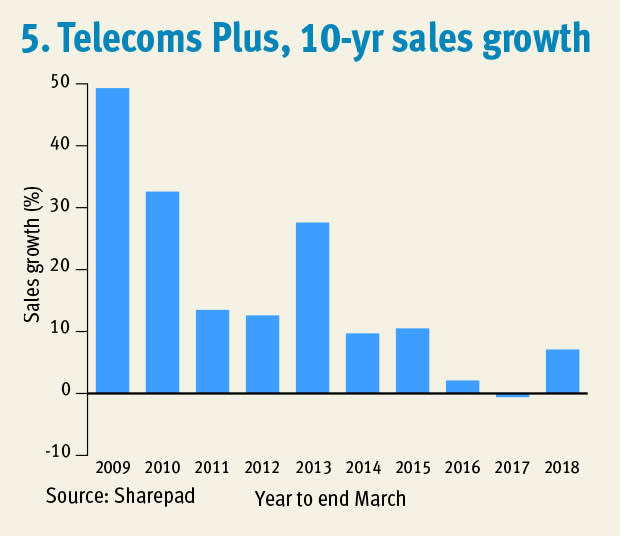
Despite these desirable characteristics, a growth slowdown over recent years (see chart below) has made for dull share price performance, especially when compared with gains made up until the shares peaked at just over 1,900p in early 2014.
A key issue that has slowed Telecom Plus’s growth has been the dynamics of the energy market, which is where the group generates about half its gross profits and four-fifths of turnover. The aforementioned supply agreement with Npower is linked to the standard variable tariffs (SVT) of the UK’s big six energy firms, and is designed to allow Telecom Plus to consistently offer its customers one of the best SVTs available. However, over recent years this has not proved a very competitive proposition. New entrants have undercut industry incumbents, and the big six energy suppliers have kept SVTs high while aggressively competing for new business with introductory teaser tariffs.
But the competitive landscape looks as though it may finally be changing in Telecom Plus's favour. Many smaller operators have recently run into trouble and have found it hard to scale up. This may prompt tougher regulation in this part of the market as well as tempering the enthusiasm of entrepreneurs to set up new ventures. Meanwhile, the planned introduction of an energy price cap at the end of the year by regulator Ofgem should push down SVTs and tone down teaser tariffs.
The nature of Telecom Plus’s energy supply agreement means falling SVTs should make it more competitive while doing minimal damage to margins. What’s more, the changing market dynamics should aid customer retention, which will help profitability – Telecom Plus already boasts leading customer retention rates.
The hope is that the change in the environment will trigger a change in the pace of growth. Good returns on capital make a business attractive, but it is when robust returns are coupled with robust growth that things become extremely interesting and the magic of compounding can really take effect. It’s the hope of a resurgence of growth that has got the share price on a roll since early last month.
The company is also benefiting from its move into new markets, such as home insurance and boiler servicing, and efforts to strengthen some of its existing, higher-margin offerings, such as mobile. And while the company has invested recently in customer support, relatively little capital is required to power growth. Indeed, it is the low capital intensity of the business, as opposed to particularly high margins, that is the key contributor to the attractive return on capital employed (ROCE) record. The limited capital requirement is also a key reason why Telecom Plus is so cash generative, which supports an attractive dividend payout and ongoing buybacks.
If the reinvigoration of Telecom Plus’s growth plays out, this screen may be just capturing the start of a good run for the shares. And there is an attractive yield to fall back on should further waiting be required. Half-year results scheduled for 20 November may give more clues as to whether the recent share price excitement has been built on solid foundations.
The defensive nature of Telecom Plus’s business also looks attractive against a backdrop of Brexit-related economic angst and volatile markets. There is one major risk, though, that does not seem to be figuring too largely in the market’s thinking at present. The nationalisation pledges of the Labour party represent something of an existential threat as this could rob Telecom Plus of its very raison d’etre.


