

Fidelity’s legendary fund manager Peter Lynch was famed for the consistency with which his Magellan fund outperformed the market. The same cannot be said for my screen based on the approach outlined in his book One Up on Wall Street.
The screen’s foundation is a dividend adjusted price/earnings growth (PEG) ratio. Mr Lynch was highly influential in popularising the PEG ratio with investors. The ratio represents a rough-and-ready way of assessing how much investors are being asked to pay for growth, and is calculated by simply dividing a price/earnings (PE) ratio by earnings growth plus dividend yield. This can be a very useful tool for investors to highlight value, but it is far from an end in itself. Among the important considerations the ratio ignores are the question of: the returns a company generates on sales and capital; the quality of its earnings; and the state of its balance sheet. What’s more, depending on its inputs, the ratio can also appear short-sighted in regard to its assessment of growth. While the ideal is to identify situations with solid long-term growth prospects, low (‘cheap’) PEG ratios can often be associated with flaky growth plays and, especially at late stages in the economic cycle, cyclical companies.
My Lynch screen is based on his approach to finding 'stalwarts', and the criteria are as follows:
■ A dividend-adjusted PEG ratio of less than one.
■ Dividend-adjusted PEG = price/earnings (PE) ratio/average forecast EPS growth for the next two financial years + historic dividend yield (DY).
■ Average forecast earnings growth over the next two financial years of between 10 and 20 per cent as long as forecast growth in each of the next two financial years is positive but below 30 per cent – attractive but not suspiciously high growth.
■ Gearing of less than 75 per cent, or in the case of financial companies, equity to assets of 5 per cent or more, and a return on assets of more than 1 per cent.
■ Three years of positive earnings.
■ Turnover of over £250m-plus.
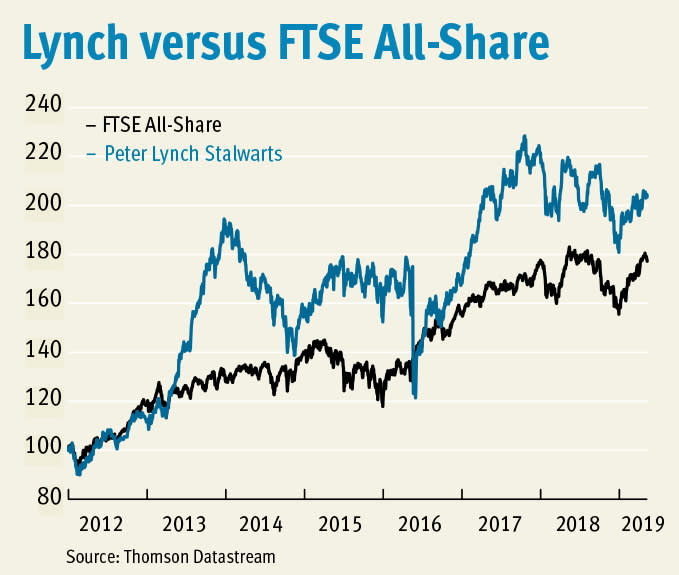
Last year the 13 stocks selected by the screen had a dismal run, producing a negative 6.8 per cent total return, compared with 3.1 per cent from the FTSE All-Share. The screen has had many downs as well as ups since I began following it seven years ago, but overall it continues to outperform the market on a cumulative basis. The total return over the period stands at 103 per cent compared with 77.2 per cent from the index. If I attempt to factor in real world dealing cost by applying a 1.5 per cent annual charge (this column takes the view that screen results are most useful as ideas for further research rather than as off-the-shelf portfolios) the total return drops to 83 per cent.
Last year's performance
| Name | TIDM | Total return (24 Apr 2018 - 3 May 2019) |
| Cineworld | CINE | 25% |
| Esure | ESUR | 23% |
| Segro | SGRO | 11% |
| SThree | STHR | 0.9% |
| McCarthy & Stone | MCS | -0.3% |
| Redrow | RDW | -1.1% |
| Carnival | CCL | -11% |
| TBC Bank | TBCG | -12% |
| Kingfisher | KGF | -12% |
| Crest Nicholson | CRST | -15% |
| Mears | MER | -24% |
| Hastings | HSTG | -28% |
| Playtech | PTEC | -44% |
| FTSE All-Share | - | 3.1% |
| Lynch | - | -6.8% |
This year eight stocks passed the screen. I’ve taken a look at the stock with the strongest three-month momentum, retailer McColl's Retail (MCLS). The situation is useful in highlighting some of the limitations faced by the PEG ratio, although brave recovery investors may find more to like than I have.
| Name | TIDM | Mkt cap | Price | Fwd NTM PE | DY | PEG* | Fwd EPS grth FY+1 | Fwd EPS grth FY+2 | 3-mth upgrades | 3-mth domentum | Net cash/debt (-) |
| TBC Bank | LSE:TBCG | £893m | 1,628p | 6 | 3.6% | 0.45 | 10% | 12% | 2.2% | 11% | -GEL1,948m |
| Kenmare Resources | LSE:KMR | £216m | 198p | 5 | - | 0.52 | 8.2% | 11% | -17% | -9.1% | $14m |
| Arrow Global | LSE:ARW | £339m | 193p | 5 | 6.6% | 0.65 | 7.1% | 14% | -8.5% | 0.3% | -£1,051m |
| Countryside Properties | LSE:CSP | £1,515m | 339p | 9 | 3.2% | 0.66 | 12% | 11% | -2.0% | 7.7% | £45m |
| McColl's Retail | LSE:MCLS | £99m | 86p | 10 | 4.7% | 0.82 | 25% | 0.1% | -3.5% | 48% | -£99m |
| PageGroup | LSE:PAGE | £1,707m | 538p | 15 | 2.4% | 0.94 | 14% | 10% | 0.8% | 20% | £98m |
| Tesco | LSE:TSCO | £24,317m | 250p | 15 | 2.3% | 0.96 | 24% | 7.5% | -0.7% | 13% | -£5,009m |
| Electrocomponents | LSE:ECM | £2,859m | 646p | 17 | 2.1% | 0.97 | 27% | 6.6% | 1.3% | 20% | -£141m |
*Dividend adjusted
Source: S&P Capital IQ
McColl's Retail
For enthusiasts of booze ‘n’ fags, it’s the products rather than their peddlers that hold allure. McColl’s Retail (MCLS), a newsagent and convenience store operator, peddles a lot of both booze (alcohol and grocery accounted for 34 per cent of 2018 sales) ‘n’ fags (cigarettes and tobacco accounted for 38 per cent). So the collapse of its key supplier, Palmer & Harvey (P&H), at the start of 2018, which left stock levels running perilously low, was very bad news. The issue was compounded by the small average basket size of McColl’s shoppers at just £5.99 and its wafer-thin margins, which means any drop in footfall stands to be keenly felt.
As far as the Lynch stock screen goes, what this means is that the low PEG ratio suggests hopes for a recovery from an annus horribilis rather than expectations of robust long-term growth. Share price performance has also reflected these hopes in the year to date. At 85p, the shares are up nearly70 per cent from their late 2018 low of 50.6p, although they also remain just over 70 per cent below their January 2017 high of 295p. The question is whether the recent share-price rally is justified and if there could be more to come?
There are good reasons to think things will improve in 2019; largely on the logic of ‘how couldn’t they’. When P&H collapsed at the start of 2018, a new supply agreement with Wm Morrison was already being rolled out. McColl’s was able to accelerate this, and by August last year its new wholesale and distribution partner was fully servicing 1,300 out of its 1,600 stores – the remainder being stores acquired from Nisa and still supplied by the former owner.
Despite the speedy work to fill the breach, the disruption contributed to a 1.4 per cent drop off in like-for-like sales in 2018 (encouragingly, final-quarter like-for-likes were flat), a gross margin decline from 26.8 per cent to 25.6 per cent and, more spectacularly, a 57 per cent drop in pre-tax profit to £7.9m. Meanwhile, the full-year dividend was only 0.6 times covered by earnings. The emergency measures taken to keep shelves full meant McColl’s also did not experience the anticipated benefit from the launch of a resurrected Safeway own-label brand in its stores. Operationally, 2019 has thankfully started on a much firmer footing.
Further reasons to be cheerful include forecasts of by the Institute of Grocery Distribution of a 3.3 per cent five-year compound average growth rate (CAGR) for convenience stores, which represent 81 per cent of McColl’s shops. Investment in store refits should help capitalise on this growth opportunity, with 86 stores revamped at the year-end. These spruce-ups are reported to be producing sustained sales growth of 5 per cent. The company plans 20 to 30 more refits in 2019, with a longer-term total target of about 400. The company is also focused on changing its sales mix to boost gross margin. Introducing new ranges, such as ‘food to go’, is also important to mitigate the gradual long-term decline in news, confectionery and tobacco sales and a faster decline in ATM income (down £1m to £6.8m last year). Meanwhile, footfall should benefit from additions to the 600 Post Offices located in stores, which are estimated to drive 600,000 visits a week. Adding to the existing 23 Subway concessions should also bring in more customers.
But while the company is clearly working to improve things, progress will not be plain sailing. Competition is very tough in convenience shopping and surveys suggest the premium shoppers are prepared to pay for convenience is reducing. At the same time, UK consumer confidence is waning. McColl’s has flagged that it expects a noteworthy rise in costs this year due to increases in wages, energy bills, and rents. If not well managed, this could significantly impact on profitability given last year’s fixed charge cover (profits available to cover the rent and interest bills as a proportion of the bills) was just 1.2 times. Capital expenditure levels also dropped back last year from 2.2 per cent of sales to 1.7 per cent, which may mean the company either needs to ramp up spending at a later date to keep its shops in shape or face a deterioration in the quality of the estate.
Net debt dropped by £30.7m last year to £98.6m, helped by a number of one-off benefits. Better payment terms from Wm Morrison were a key reason for operating cash flow jumping from £54.2m to £61.8m. Indeed, if payables (amounts owed) had remained unchanged as a proportion of sales in 2018, operating cash would have only been £25.4m.
Another one-off benefit to 2018 cash flow came from the sale and leaseback of freeholds from the Nisa acquisition. But the flip-side to such disposals – which raked in £26.3m in 2018 – is a higher future rent bill. Sale-and-leaseback transactions effectively replace debt with new debt-like lease obligations. New accounting rules now require lease liabilities to be reported on companies’ balance sheets. Using the rough-and-ready method of multiplying last year’s £35.9m rent bill by seven puts a £251m value on McColl’s lease obligations, which dwarfs the company’s market capitalisation.
The new lease-accounting rules also require companies to record the cost of leases as a notional depreciation and interest charge rather than simply using the rent figure. While in many ways this is a cosmetic change, it is of note that in a recent sector review broker Liberum calculated the rule change could result in McColl’s shares looking 25 per cent more expensive based on a PE ratio valuation. Given PE is a key component of the PEG ratio, the take home for the Lynch screen is that the new rules may cause the PEG to jump.
With a relatively low gross margin, significant fixed charges, and upward pressure on operating costs, this is a business that could easily disappoint investors’ expectations. Indeed, it has a track record of doing so. That said, while cash conversion in 2018 was flattered by a number of one-offs, in other regards it would be hard to top last year for bad news – but by no means impossible.
Based on the company’s current circumstances and stretched balance sheet (net debt plus estimated lease obligations total £350m), this is not presently a share investors would want as a ‘stalwart’ in their portfolio. In fact, during 2018 the company had to ask banks to increase the covenant headroom on loans and flexibility in their facilities, which illustrates just how tough things are.
The shares could be of some interest as a recovery trade for those who like highly geared (operationally and financially) situations. The level of the dividend yield is also enticing. However, the payout looks to be on weak ground given trading conditions and the aforementioned balance sheet concerns. These issues also mean a low double-digit forward earnings multiple – which could possibly jump due to new accounting rules – suggests there is already a fair amount of hope factored into the share price.


