

Last year I made a change in the way I ran my Jim Slater inspired Small Cap screen based on suggestions from the great man himself before he sadly passed away at the end of 2015. With valuations high, my original tactic to make the screen produce results had been to stick with a strict valuation criteria (a price-to-earnings-growth ratio of less than 0.75) but allow a looser quality criteria. Mr Slater, however, took issue with this advancing the view that when valuations are high, the PEG requirements of his stock-picking system can be relax but investors need to double down on quality. Naturally, I adapted the screen when I ran it last year to take Mr Slater’s advice on board. The result? A knock-out 71 per cent total return over 12 months from the six stocks picked by the screen. And while small caps in general had a storming run during the period, the return from the screen were still more than double the average return from the FTSE Small Cap and Aim All-Share of 35 per cent.
2016/17 SLATER SMALL-CAP PERFORMANCE
| Name | TIDM | Total return (6 Jul 2016 to 3 Jul 2017) |
| Serica Energy | SQZ | 146% |
| Microgen | MCGN | 131% |
| UK Mail | UKM | 54% |
| Air Partner | AIR | 46% |
| Lighthouse Group | LGT | 45% |
| Cambria Autos | CAMB | 3.9% |
| FTSE Small Cap | - | 30% |
| FTSE Aim All-Share | - | 40% |
| FTSE Small/Aim | - | 35% |
| Slater Small Caps | - | 71% |
Source: Thomson Datastream
While my previous incarnation of the screen may not have done full justice to the Slater approach as outline in his classic book “The Zulu Principle”, it has produced sound results. Indeed, on a 12-month basis, the shares selected by the screen have only underperformed the market in one of the last four years. That means, the recent stellar run over builds on solid foundations and the cumulative total return since mid-2013 now stands at 117 per cent compared with 52 per cent from a combination of the FTSE Small Cap and Aim. If I add in a notional annual charge of 2.5 per cent to account for dealing costs, including the wide spreads associated with smaller companies, the total return over the four years is 96 per cent.
Slater vs small caps
Mr Slater was a strong advocate of using the price-to-earnings-growth (PEG) ratio for seeking out undervalued growth companies. The PEG simply divides a price-to-earnings (PE) ratio by a company’s earnings growth rate. The PEG ratio I use for this screen uses a PE based on last year’s earnings and a growth rate based on the average of the forecasts for the next two financial years. The PEG, and variants thereof, have also been championed by influential US investors John Neff and Peter Lynch.
Mr Slater’s suggestion when he wrote The Zulu Principle was that investors should hunt for small caps (he famously preferred smaller companies because “elephant’s don’t gallop”) with PEG ratios of 0.75 or less. As explained above, the criteria has been relaxed for this screen due to relatively high valuations in the market. For this screen, companies only need to display a PEG in the bottom quarter of shares screened, which means 0.9 or less for the Aim market and 1.5 or less for stocks on the main list.
However, on its own the PEG ratio is something of a blunt tool and Mr Slater has a number of supporting criteria to help investors discern the wheat from the chaff. Not all of his suggestions are easy to screen for, the importance of an upbeat outlook statement and “something new” contributing to the investment case. However, the screening criteria below are an attempt to build in some of the ideas Mr Slater presents in The Zulu Principle where financial data can offer a steer.
CRITERIA
■ A PEG ratio (PE divided by average forecast earnings growth for the next two financial years) in the bottom quarter of all stocks screened. It's worth bearing in mind that small-cap earnings forecasts are often not of the highest quality (nb FTSE All-Share, All Small and Aim have been screened separately).
■ Market cap of less than £750m but more than £10m.
■ Net-debt-to-cash-profits ratio of less than 1.5.
■ Cash conversion of 90 per cent or more.
■ Return on equity of more than 12.5 per cent or an operating margin of 15 per cent or over.
■ Three-month momentum higher than the median average, or forecast EPS upgrades of 10 per cent or more over the past year.
■ Forecast earnings growth in each of the next two financial years and average forecast growth of more than 10 per cent but less than 50 per cent (anything above 50 per cent is considered an unsustainable growth rate for the purposes of this screen).
I’ve screened the FTSE Aim All-Share and the FTSE All-Share separately to help increase the number of results. In all, six stocks passed all of the screen’s criteria split evenly between Aim and main market shares. All the picks are listed in the table below and I’ve taken a closer look at three of the qualifying stocks to give a flavour of the results.
SIX SLATER SMALL CAPS
| Name | TIDM | Mkt cap | Price | Fwd NTM PE | DY | PEG | Fwd EPS grth FY+1 | FY EPS gr+2 | 3mth mom | Net cash/debt (-) |
| Robert Walters | LSE:RWA | £304m | 425p | 15 | 2.0% | 1.3 | 13% | 12% | -0.8% | £23m |
| Vp | LSE:VP. | £345m | 875p | 11 | 2.5% | 1.4 | 14% | 5.8% | 7.1% | -£99m |
| Morgan Sindall | LSE:MGNS | £549m | 1,250p | 13 | 2.8% | 1.1 | 18% | 8.6% | 22% | £208m |
| Impax Asset Management | AIM:IPX | £104m | 95p | 20 | 2.4% | 0.7 | 31% | 32% | 19% | £29m |
| Defenx | AIM:DFX | £17m | 141p | 8 | - | 0.3 | 10% | 48% | 47% | -€0.8m |
| Central Asia Metals | AIM:CAML | £229m | 213p | 10 | 7.3% | 0.9 | 24% | 2.0% | -7.3% | $40m |
Source: S&P Capital IQ
Construction and facilities management firm Morgan Sindall (MGNS) looks like it may be in an exciting position to produce strong growth over coming years. The company is involved in a range of activities spanning infrastructure construction, property fit out, facilities management, urban regeneration and affordable home building. Buoyant end markets means the company is firing on all cylinders at the moment. Importantly, the strong balance sheet means Morgan Sindall is in a great position to exploit the opportunities the strong trading backdrop brings.
In particular, management is keen to invest in regeneration activities, which include house building as well as the urban regeneration. This area currently account for just over a third of profit and management sees scope to more than double the level of capital employed by these activities from £191m last year to £400m by 2021. Excitingly, the company believes a hearty 20 per cent return on capital employed (ROCE) can be achieved from this investment. Underpinning these hopes are the well-documented need for more housing in the UK and the group’s “partnership” model which is expected to act as a barrier to entry against competitors. As part of this plan to achieve high-return growth, the company is looking to improve capital turn (a key component determining ROCE) by moving money out of slower moving projects.
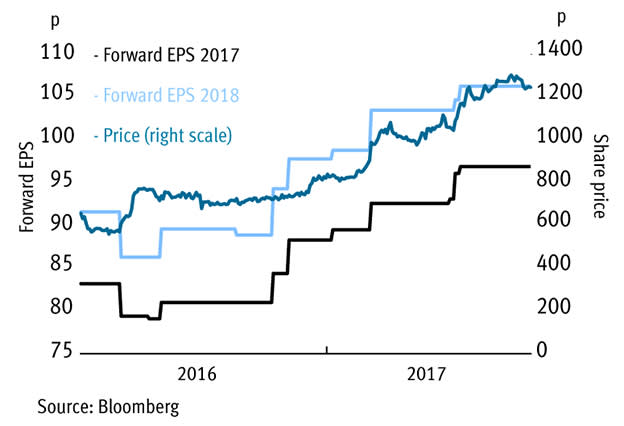
The cyclical and capital intensive nature of Morgan Sindall’s business means the market can be expected to put a lower value on its growth than would be the case with companies in sectors considered to offer more reliable returns. Indeed, by Morgan’s shares’ own historic standards, the current earnings multiple looks high in the top 10 per cent of the five-year range. However, growth prospects, and Morgan’s ability to pursue these opportunities, look very enticing and have driven a string of forecast upgrades since analysts got over the Brexit shock (see graph). Based on the long-term potential, there are grounds to think the upgrade cycle will continue along with positive implications for the shares.
Morgan Sindall's upgrade cycle
Last IC View: Buy, 973p, 27 Feb 2017
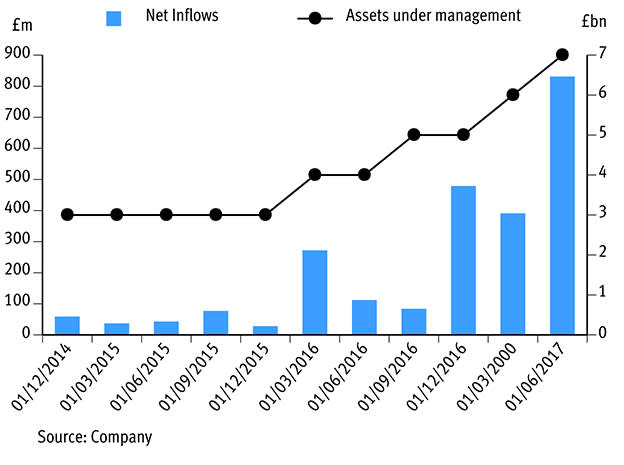
Over the past few years, cash has been flooding into funds run by sustainable investment specialist Impax Asset Management (IPX) (see graph). Indeed, in the three months to the end of June, net inflows of £831m represented more than the combined total for the last two financial years (2016: £479m, 2015: £216m). The recovery in energy prices will have certainly aided sentiment, and will have increased assets under management by helping power strong investment gains. But the company has also been benefiting from a distribution agreement with BNP Paribas, which gives it a wider reach, as well as rising interest based on the increased commercial viability on the alternatives sector, and demographic changes and global development.
Impax AUM and net inflows
Impax focuses on a number global equity strategies across energy efficiency, renewable energy, water, waste and resource recovery, food and agriculture related markets. The firm’s clients are mainly institutions, which are generally regarded as more desirable backers because they’re less prone to withdraw funds based on short-term changes in market sentiment. The company also invests in private companies and infrastructure as well as listed equities.
Broker Peel Hunt believes that if asset inflows continue at recent elevated levels during the company’s 2018 financial year, EPS forecasts for 2019 will need to be upgraded by as much as 17 per cent (an assessment made by the broker before the bumper three months to the end of June was reported).
True, asset flows can be fickle, especially for asset managers with a tightly defined focus, which is the case with Impax. However, investors seem to be putting little value on Impax’s growth given that after adjusting for its net cash, the shares are valued at just 11.5 times Peel Hunt’s forecast earnings for 2018 – well below the unadjusted next-12-month PE number in the accompanying table. The rating could underplay the potential for assets to continue to roll in, especially given the firm’s investment strategies are based on very long-term trends that institutional investors seem to be seeing increased promise in.
Last IC View: Hold, 105p, 19 May 2017
For recruitment companies like Robert Walters (RWA), the general health of the economy is key to growth prospects. The increased activity in the job market associated with buoyant economic conditions not only boost sales but also means recruitment consultants are able to place more staff and charge higher fees for each position filled. This magnifies the impact of rising sales on profits – a phenomena City-types term “operating gearing”.
While valuations of recruiters are up strongly from post-Brexit lows, share ratings still reflect uncertainty about the economic outlook, especially in the UK. Indeed, the fact Robert Walters’s shares looks cheaper than those of its peers may well reflect the fact that it does a lot of work for the finance industry in the UK which faces a number of Brexit-related uncertainties.
However, in other respects Robert Walters actually looks like one of the best placed white-collar recruiters for growth. One of the reasons for this is that it has a thriving business in the Asia Pacific region and has established a leading positions in some fast-growing specialism, such as finding bilingual job candidates. The company is also the most exposed of the listed UK recruiters to the “resource solutions outsourcing (RSO)” trend. This involves Walters taking over all or part of a client’s recruitment activities. Broker Investec estimates about a fifth of group net fee income is now generated from this business.
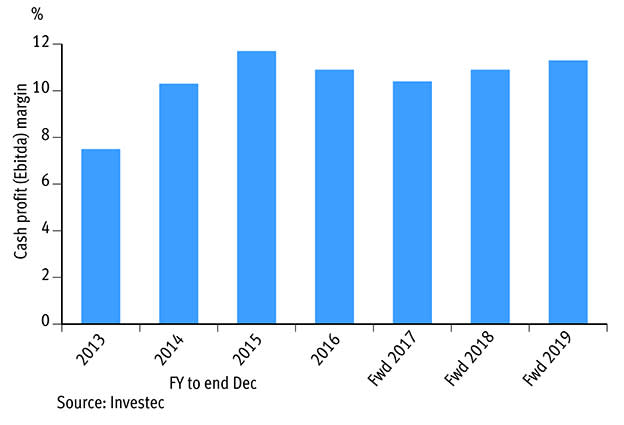
While RSO is seen as an exciting area for long-term growth, especially in more mature markets such as the UK, ironically, Walters’ RSO strength is arguably also leading to some perceived weakness. Investment in developing a first-rate RSO operation has weighed on margins in recent years, muting the impact of rising sales on profits and offsetting progress made cutting overheads and improving consultant productivity. However, the margin squeeze caused by the investment could now be set to reverse, as reflected in the graph below which shows Investec’s forecasts of a margin recovery. And it’s worth noting, margins are currently about half the level they were when they peaked at in 2007.
R Walters' forecast margin rebound
If the predicted upturn in profitability materialises, and the UK recruitment market continues to hold up as it has to date, investors’ attention may switch to Walters' growth potential. Should that happen, the current enterprise-value-to-forecast-net-fee-income ratio (the recruitment sector’s equivalent to a price-to-sales ratio adjusted for debt) of 0.9 is likely to begin to look a real bargain. The strong balance sheet also mean capital returns may well continue to support the share price.
Last IC View: Buy, 443p, 12 Apr 2017


