
The latest Coffer Peach Tracker, which analyses trends in the eating and drinking-out market, found that Britain’s managed pub and restaurant groups saw collective like-for-like sales growth of just 0.2 per cent in October. Against this tepid backdrop, it may be tempting to see promise in full-year results from Mitchells & Butlers (MAB). Like-for-like drinks sales were up 2.6 per cent, while food sales improved 0.3 per cent. However, these sales figures were driven by price increases rather than volume growth, which may have limited mileage in the face of growing consumer uncertainty. Meanwhile, the group continues to face challenges from fierce competition in the sector and rising costs, all of which are weighing on returns.
Reducing leverage
Growth in drinks sales
Little volume growth
Competitive casual dining sector
Lower return on capital
Cut dividend
Mitchells & Butlers' portfolio of 18 brands includes All Bar One, Nicholson’s, Harvester and Browns. These brands are prolific on the high street, which makes the company exposed to the well-reported decline in high-street footfall. This will do no favours to the group’s sluggish sales growth, and costs are rising. During the last financial year the operating profit margin fell from 14.3 to 14.1 per cent after 1.3 per cent like-for-like sales growth and £28m of cost savings were not enough to offset an estimated £60m of cost inflation, evident especially in wages, energy, property and purchasing. Margins face further pressure in the new financial year from expected cost inflation of between £60m and £65m, partially offset by another £28m of expected cost savings.
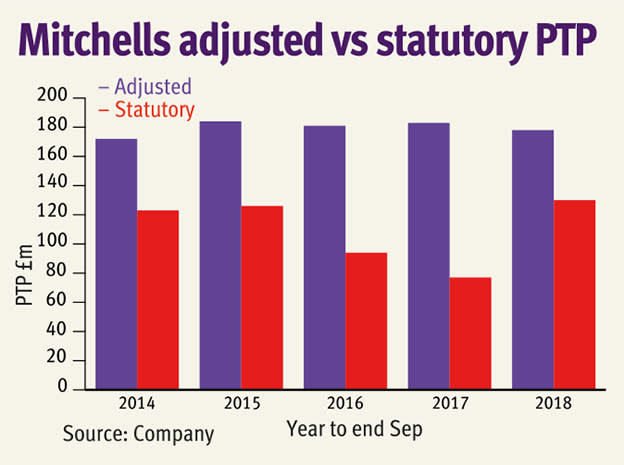
To try to keep trading brisk, Mitchells has dipped into its pockets to spruce up its pubs. Last year it completed 232 remodels and conversions and has narrowed its investment cycle period from 11-12 years to 6-7 years. While this may make for a more pleasant customer experience (apart from when the work is being done), it has weighed on cash flows – last year saw a £19m free cash outflow – while the adjusted return on capital employed has sunk from 7.5 per cent two years ago to 6.7 per cent over the past 12 months. Meanwhile, the gap between reported and adjusted profits over the past five years has been consistently of note, which largely reflects property-related pain.
None of this is easy for a company as indebted as Mitchells – high debt is not uncommon in the pub sector. Indeed, management's decision to cancel the dividend looks sensible with net debt standing at £1.7bn, or four times cash profits – this was down from 4.2 times in 2017. The debt does not take any account of the company's use of leases, which if valued at seven times 2017's hire and rental costs of £86m, would be equivalent to £602m of extra liabilities (rent and costs for the last financial year are yet to be published, although accounting rule changes mean these debt-like liabilities will have to be reported by companies on their balance sheets from next year).
| MITCHELLS & BUTLERS (MAB) | ||||
| ORD PRICE: | 268p | MARKET VALUE: | £1.15bn | |
| TOUCH: | 268-269p | 12-MONTH HIGH: | 287p | LOW: 221p |
| FW DIVIDEND YIELD: | NIL | FW PE RATIO: | 7 | |
| NET ASSET VALUE: | 413p | NET DEBT: | 96% | |
| Year to 29 Sep | Revenue (£bn) | Pre-tax profit (£m) | Earnings per share (p) | Dividend per share (p) |
| 2016 | 2.09 | 181 | 34.8 | 7.5 |
| 2017 | 2.18 | 183 | 34.8 | 7.5 |
| 2018 | 2.15 | 178 | 34.1 | 5.0 |
| 2019* | 2.19 | 185 | 34.6 | nil |
| 2020* | 2.25 | 192 | 35.8 | nil |
| % change | +3 | +3 | +3 | - |
| Normal market size: | 3,000 | |||
| Matched bargain trading | ||||
| Beta: | 0.77 | |||
| *Peel Hunt forecasts, adjusted PTP and EPS figures | ||||


