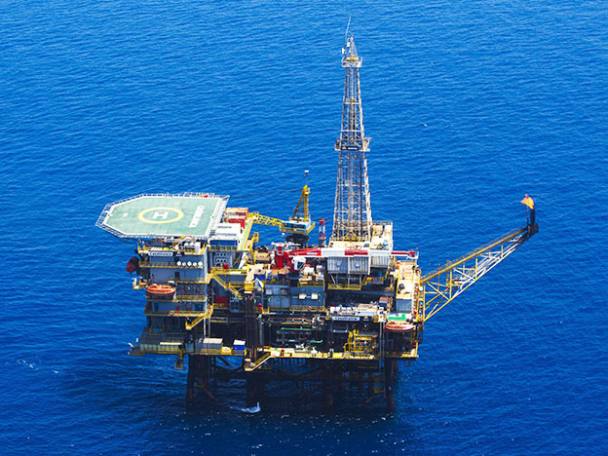
Wood Group (WG.) has made big leaps in diversifying its business in recent years, dropping its exposure to the oil and gas industry and growing its renewables and consulting businesses. But it is still reliant on oil and gas companies for a large part of its services and design work, and analysts forecast a drop across the energy sector in response to Covid-19, including for renewables contracts.
Liquidity buffer
Cost cutting
Oil and gas exposure
Likely hit to order book from Covid-19
Low margins
Since plummeting in March, the oil price has made a slight recovery on the back of falling production and recovering demand in China and India in the past few weeks. But the $30 (£25) per barrel (bbl) level will still see dozens of US producers go bust, according to Rystad Energy, which says around 200 companies could go under this year and next year if prices don’t improve dramatically. RBC has forecast a 20-30 per cent drop in sales for Wood Group’s asset solutions business, which provided 70 per cent of 2019 revenue, because of the oil price plunge.
Wood Group also sells services to renewables companies, which will also likely see a hit from Covid-19. Consultancy Wood Mackenzie has forecast a dip in renewables construction in the Asia-Pacific region with its 2024 capacity forecasts down 5 per cent, although it still sees plenty to like in the sector. In North American solar, WoodMac said the biggest hit would come this year (including both residential and large-scale projects) before the industry mostly caught up next year. Wood Group got 25 per cent of its revenue from renewables in 2019, and was hoping to double sales this year.
Chief executive Robin Watson said on an investor call in May the group has recognised oil and gas would not be an area of growth in the coming years. “Growth will come from early-stage front-end engineering and design (FEED) work in Asia Pacific and operations work in the Middle East and the UK spending increases,” he said.
Updates from oil and gas companies following the oil price tumble have shown early projects have been put off until there is more certainty over oil prices and operational safety during the pandemic.
At the start of April, 70 per cent of Wood Group’s 2020 revenue was delivered or secured, but the group warned of potential postponements. The next trading update is set for mid-June.
So far in reaction to Covid-19, Wood Group has cut capital expenditure (around $25m saved), called off the final 2019 dividend and reduced salaries by $40m. With administration expenses of $867m in 2019, this is not a major cut, although the group had already seen a big drop in admin costs from over $1bn in 2018.
Looking at the business’s underlying performance, its adjusted cash profit (Ebitda) margin grew on a like-for-like basis between 2018 and 2019 from 8.5 to 8.9 per cent. But using a standardised Ebitda figure from S&P Capital IQ and comparing with similar companies, Wood Group is way behind. Its trailing 12-month Ebitda margin stands at 5.5 per cent, while Hunting (HTG) stands at 12.7 per cent, Weir Group (WEIR) at 14.5 per cent and Petrofac (PFC) at 9.3 per cent.
Wood Group is looking to boost profitability by “delivering improved operational efficiency and cost reductions”. But while the cost reduction part is going ahead with added urgency, it’s unclear how the group can make significant operational gains when protecting workers from Covid-19.
| Wood Group (WG.) | |||||
| ORD PRICE: | 202p | MARKET VALUE: | £1.4bn | ||
| TOUCH: | 202-203p | 12-MONTH HIGH: | 561p | LOW: | 101p |
| FORWARD DIVIDEND YIELD: | 14.9% | FORWARD PE RATIO: | 17 | ||
| NET ASSET VALUE: | 662ȼ* | NET DEBT: | 46%** | ||
| Year to 31 Dec | Turnover ($bn) | Pre-tax profit ($m) | Earnings per share (ȼ) | Dividend per share (ȼ) | |
| 2017 | 9.9 | -22 | -7.0 | 34.0 | |
| 2018 | 11.0 | 54 | -1.0 | 35.0 | |
| 2019 | 9.9 | 149 | 11.0 | 34.0 | |
| 2020*** | 8.2 | 50 | -4.0 | 36.0 | |
| 2021*** | 8.5 | 171 | 14.0 | 37.0 | |
| % change | +4 | +242 | - | +3 | |
| Normal market size: | 3,000 | ||||
| Beta: | 3.00 | ||||
| *Includes intangible assets of $6.3bn, or 938ȼ a share | |||||
| **Includes lease liabilities of $574m | |||||
| ***RBC Capital Markets forecasts | |||||
| £1=$1.23 | |||||


