

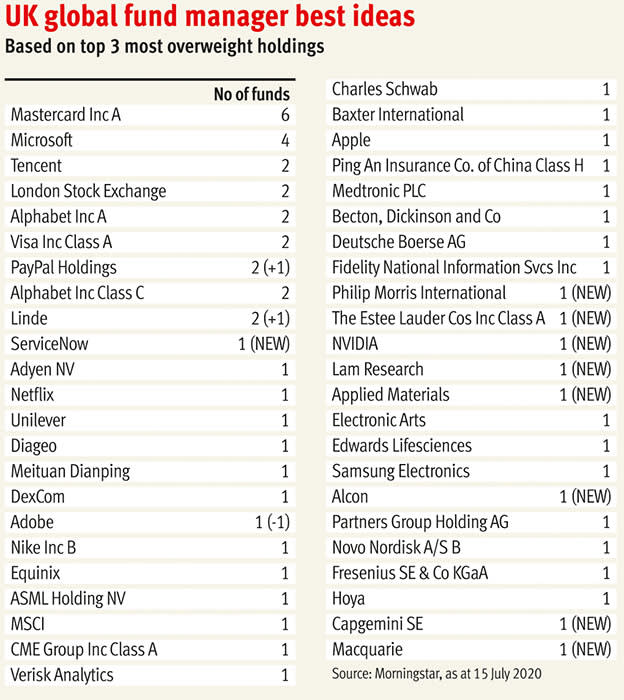
The latest Bank of America (BoA) fund manager survey has set a new record for most crowded trade. With 74 per cent of the vote, US tech stocks have been crowned “the longest ‘long’ of all-time” – *or at least since the survey started in 2013. Anyone casting an eye over the accompanying table of best ideas of top global funds will see this phenomenon writ large there too.
The extreme popularity of US tech – and other big tech plays – should perhaps not come as too much of a surprise, or necessarily be seen with undue foreboding. For one thing, the survey has been conducted during exceptional times. Big US tech companies look like some of the few potential winners from the Covid crisis. It makes sense therefore that the fund managers contributing to the BoA also reckon a Covid vaccine is the biggest threat to tech share prices. Meanwhile healthcare, the other big Covid beneficiary, was the next most popular trade.
Another potential caveat in regard to tech’s record popularity is that the boundary between tech and other sectors is increasingly blurred. Many would regard Amazon (US:AMZN) as a tech stock, for example. Yet a large portion of its sales are from retail and the most profitable part of the business is cloud storage. For index classification purposes it’s a 'consumer discretionary' company. Go figure. In our home market, Ocado for a long time was best thought of as a grocer, but license agreements have moved it more into the tech sphere… or do the massive capital commitments associated with its technology services contracts make it more of a logistics and property company?
As 'tech' becomes ever more ubiquitous, trying to strictly define the sector is likely to become increasingly futile and misleading. What does look likely is the most exciting companies will continue to relentlessly harness the power of technology to build better businesses and achieve higher rates of growth.
The fact the US has been a breeding ground for tech success should also perhaps come as little surprise. Wild west entrepreneurialism aside (yee ha!), the size and global influence of the country lends itself particularly well to building the kind of monopolistic power that has been so important to the global success of the very biggest tech plays.
But herein perhaps lies an even bigger long-term risk to the most-crowded-trade-ever than a Covid vaccine. For good reason, a lot of people don’t like monopolies. People also don’t like companies that dodge tax, as big tech is widely seen to do. A big US election win for the Democrats, as current polling suggests is a genuine possibility, could see firm action on these issues, which would make life uncomfortable for big tech companies and their shareholders. Republicans are also well aware of the popular discontent.
Such fears may have contributed to a recent (at the time of writing) sharp setback for tech stocks, which means for the first time in a long time the Ideas Farm 52-week highs table isn’t peppered with the names of investment trusts with large tech positions. Interestingly though, the 52-week highs list does pick up on some of the other emerging themes coming out of the BoA survey: commodities and European equities. The popular healthcare theme is also evident in the list.
While the list of stocks making new highs is once again far longer than the list of new lows, another finding from the BoA survey is that the mood among professional investors certainly does not seem dangerously bullish. Only 14 per cent think there will be a V-shaped recovery, with 44 per cent going for a 'U' and 30 per cent a 'W'. Cash levels in portfolios are rising, while 71 per cent think stocks are overvalued. The best bull markets often climb a wall of worry, though, so pessimism from this type of survey does not necessarily need to be viewed negatively.
Our tips section this week hits a lot of the themes highlighted by the BoA survey, and a number of the ideas we’ve looked at have featured in the Ideas Farm over recent weeks in our fund manager 'Best Ideas' lists. For tech-lovers we have cyber-security company Avast (AVST) -– although the monopolistic power of Microsoft is a potential threat. For healthcare fans there’s GlaxoSmithKline (GSK), and for those hoping to ride upside in commodities we have Atalaya Mining (ATYM).
Click here to view the tables in PDF form
| New 52-week highs | |||
| Name | TIDM | Price | % from high |
| Rentokil Initial | RTO | 542p | 0.1% |
| Octopus Renewables Infra | ORIT | 114p | 0.2% |
| Croda International | CRDA | 5,480p | 0.2% |
| Antofagasta | ANTO | 1,008p | 0.3% |
| Fresnillo | FRES | 1,005p | 0.5% |
| Syncona | SYNC | 269p | 0.6% |
| Bunzl | BNZL | 2,225p | 0.8% |
| Personal Assets Trust | PNL | 44,650p | 0.8% |
| Best of the Best | BOTB | 1,680p | 0.8% |
| Reckitt Benckiser Group | RB | 7,678p | 1.0% |
| SEGRO | SGRO | 936p | 1.0% |
| BBGI | BBGI | 169p | 1.1% |
| Henderson EuroTrust | HNE | 1,270p | 1.4% |
| Civitas Social | CSH | 110p | 1.4% |
| International Public | INPP | 169p | 1.5% |
| Cello Health | CLL | 163p | 1.5% |
| Bankers Invt Trust | BNKR | 1,022p | 1.5% |
| Capital Gearing Trust Plc | CGT | 4,420p | 1.6% |
| International Biotech | IBT | 800p | 1.6% |
| JPMorgan Japanese Invt | JFJ | 544p | 1.6% |
| Rio Tinto | RIO | 4,825p | 1.7% |
| Spirax-Sarco Engineering | SPX | 10,050p | 1.7% |
| Renishaw | RSW | 4,264p | 1.8% |
| BlackRock Greater Eu Invt | BRGE | 433p | 1.8% |
| Baillie Gifford Shin | BGS | 194p | 1.8% |
| Premier Foods | PFD | 88p | 1.9% |
| Gore Street Energy | GSF | 103p | 1.9% |
| Verditek | VDTK | 13p | 1.9% |
| Shanta Gold | SHG | 15p | 2.0% |
| JLEN Env Assets Group | JLEN | 122p | 2.0% |
| Fidelity European Values | FEV | 267p | 2.0% |
| Smithson Investment Trust | SSON | 1,498p | 2.1% |
| Centamin | CEY | 189p | 2.2% |
| JPMorgan Global Core Real | JARA | 110p | 2.2% |
| JPMorgan Global Core Real | JARA | 110p | 2.2% |
| Martin Currie Global Port | MNP | 323p | 2.3% |
| JTC | JTC | 470p | 2.3% |
| B&M European Value Retail | BME | 433p | 2.3% |
| Polar Cap Gbl Healthcare | PCGH | 250p | 2.3% |
| Schroder AsiaPacific Fund | SDP | 490p | 2.4% |
| YouGov | YOU | 790p | 2.5% |
| BlackRock World Mining Tr | BRWM | 394p | 2.5% |
| JBM CN Grw&Inc | JCGI | 526p | 2.6% |
| Triple Point Social Housing REIT | SOHO | 104p | 2.8% |
| Hipgnosis Songs | SONG | 120p | 2.8% |
| Baker Steel Res Trust | BSRT | 61p | 2.9% |
| Robinson | RBN | 119p | 2.9% |
| Fidelity Japan Trust | FJV | 179p | 3.0% |
Source: FactSet (15 Jul 20)
| New 52-week lows | |||
| Name | TIDM | Price | % from low |
| Oxford Metrics | OMG | 71p | 0.0% |
| Rotala | ROL | 25p | 0.8% |
| Gem Diamonds | GEMD | 24p | 1.6% |
| John Laing Group | JLG | 281p | 1.9% |
| Headlam Group | HEAD | 252p | 2.0% |
| STV Group | STVG | 220p | 2.3% |
| Pittards | PTD | 40p | 2.5% |
| UK Oil & Gas | UKOG | 0p | 2.7% |
| RTC Group | RTC | 36p | 2.8% |
| Galliford Try Holdings | GFRD | 101p | 2.8% |
| TOC Property Backed Lndng | PBLT | 86p | 2.9% |
Source: FactSet (15 Jul 20)
| Shorts | |||
| Company | Short Interest | No. Shorters | 1wk chg in short interest |
| HAMMERSON PLC | 13.1% | 9 | 0.5% |
| METRO BANK PLC | 9.5% | 4 | 0.0% |
| PREMIER OIL PLC | 8.7% | 3 | 0.0% |
| TULLOW OIL PLC | 8.2% | 6 | 0.1% |
| PEARSON PLC | 6.5% | 6 | 0.1% |
| PETS AT HOME GROUP PLC | 5.5% | 3 | -0.2% |
| DOMINO'S PIZZA GROUP PLC | 5.5% | 7 | -0.4% |
| PETROFAC LTD | 5.4% | 5 | 0.1% |
| GW PHARMACEUTICALS PLC | 5.2% | 4 | 0.0% |
| PETROPAVLOVSK PLC | 5.2% | 1 | 0.0% |
| BABCOCK INTL GROUP PLC | 4.9% | 3 | 0.3% |
| FUTURE PLC | 4.9% | 3 | 0.1% |
| BLUE PRISM GROUP PLC | 4.8% | 5 | 0.1% |
| CRODA INTERNATIONAL PLC | 4.6% | 5 | -0.1% |
| SAINSBURY (J) PLC | 4.5% | 3 | 0.8% |
| WEIR GROUP PLC/THE | 4.1% | 5 | 0.0% |
| VODAFONE GROUP PLC | 4.0% | 4 | 0.1% |
| WM MORRISON SUPERMARKETS | 4.0% | 3 | 0.3% |
| ASCENTIAL PLC | 3.9% | 5 | -0.1% |
| SMITH (DAVID S) HOLDINGS PLC | 3.9% | 5 | -0.6% |
| TUI AG | 3.9% | 4 | -0.1% |
| CAPITA PLC | 3.7% | 5 | 0.1% |
| WOOD GROUP (JOHN) PLC | 3.7% | 6 | -0.2% |
| DIGNITY PLC | 3.7% | 3 | -0.4% |
| MICRO FOCUS INTERNATIONAL | 3.5% | 3 | 1.1% |
| KEYWORDS STUDIOS PLC | 3.5% | 4 | 0.0% |
| A.G. Barr PLC | 3.4% | 3 | -0.3% |
| MARKS & SPENCER GROUP PLC | 3.2% | 2 | 0.0% |
| Primary Health Properties PLC | 3.1% | 4 | -0.1% |
| ULTRA ELECTRONICS HLDGS PLC | 3.0% | 1 | 0.0% |
| RESTAURANT GROUP PLC | 3.0% | 3 | 0.1% |
| VICTREX PLC | 2.9% | 3 | 0.2% |
| DAILY MAIL & GENERAL TRUST | 2.8% | 3 | -0.2% |
| ASHMORE GROUP PLC | 2.8% | 3 | 0.5% |
| VALARIS PLC | 2.8% | 1 | 0.0% |
| HARGREAVES LANSDOWN PLC | 2.7% | 4 | 0.1% |
| INTERCONTINENTAL HOTELS GROUP PLC | 2.7% | 2 | 0.1% |
| HISCOX LTD | 2.6% | 2 | NEW |
| AUTO TRADER GROUP PLC | 2.6% | 4 | -0.5% |
| AA PLC | 2.5% | 2 | 0.0% |
| Signature Aviation PLC | 2.5% | 4 | 0.0% |
| BRITISH LAND CO PLC | 2.4% | 3 | 0.0% |
| NETWORK INTERNATIONAL HOLDINGS PLC | 2.4% | 3 | NEW |
| VIRGIN MONEY UK PLC | 2.4% | 3 | -0.1% |
| BURBERRY GROUP PLC | 2.3% | 3 | -0.8% |
| N. Brown Group | 2.3% | 2 | 0.0% |
Source: FCA, as at 15 July 2020
| Upgrades | ||||
| Wednesday, 15 July 2020 | FWD EPS CHG | |||
| Name | TIDM | 1mth | 3mth | 1yr |
| Yellow Cake | YCA | 3076.2% | - | 3825% |
| IGas Energy | IGAS | 400.0% | -92.6% | -89% |
| ZOO Digital Group | ZOO | 337.1% | - | -1% |
| Trackwise Designs | TWD | 226.9% | 157.6% | 70% |
| Draper Esprit | GROW | 209.2% | 26.9% | -22% |
| Gear4music Holdings | G4M | 164.0% | 356.7% | 307% |
| Best of the Best | BOTB | 110.2% | 168.5% | 311% |
| System1 Group | SYS1 | 105.3% | 181.7% | 27% |
| Totally | TLY | 96.4% | 96.7% | - |
| RM | RM | 92.1% | -76.7% | -76% |
| Atalaya Mining | ATYM | 91.6% | 39.2% | -47% |
| Antofagasta | ANTO | 83.0% | 35.1% | -50% |
| United Oil & Gas | UOG | 76.8% | - | - |
| Hummingbird Resources | HUM | 71.2% | - | -5% |
| Luceco Plc | LUCE | 63.2% | 20.1% | 18% |
| De La Rue | DLAR | 61.9% | 57.0% | -55% |
| Numis | NUM | 45.8% | - | 38% |
| TI Fluid Systems | TIFS | 44.8% | -84.1% | -92% |
| Equals Group | EQLS | 42.9% | 42.9% | 0% |
| 3i Group Plc | III | 40.0% | - | -38% |
| ECO Animal Health Group | EAH | 35.1% | 39.6% | -58% |
| DWF Group | DWF | 34.6% | -25.9% | -1% |
| Codemasters Group Holdings | CDM | 34.6% | 37.1% | 20% |
| CMC Markets | CMCX | 31.2% | 7.2% | 320% |
| Up Global Sourcing Holdings | UPGS | 30.9% | -15.3% | 0% |
| Just Eat Takeaway.com | JET | 28.7% | 33.5% | - |
| 888 | 888 | 28.0% | 13.1% | 3% |
| Manolete Partners | MANO | 27.4% | 35.0% | 37% |
| ContourGlobal Plc | GLO | 25.8% | -11.7% | -28% |
| Royal Dutch Shell | RDSA | 24.8% | -41.7% | -84% |
| Iofina | IOF | 23.7% | 134.6% | 50% |
| Eckoh | ECK | 22.8% | 22.8% | 23% |
| NCC Group | NCC | 22.7% | 22.7% | -22% |
| BOKU | BOKU | 22.1% | 22.7% | 44% |
| Royal Dutch Shell | RDSB | 18.8% | -45.9% | -84% |
| Shearwater Group | SWG | 17.9% | 17.4% | - |
| Photo-Me | PHTM | 17.7% | 35.9% | 2% |
| Motorpoint Group | MOTR | 17.3% | 17.3% | 22% |
| EKF Diagnostics | EKF | 16.6% | 58.9% | - |
| Fresnillo | FRES | 16.5% | 17.8% | -26% |
| Frasers Group | FRAS | 16.2% | -15.3% | 8% |
| Helical | HLCL | 16.0% | -18.8% | -3% |
| boohoo group | BOO | 15.7% | 29.9% | 50% |
| Capital | CAPD | 14.5% | 7.7% | 40% |
| National Express Group | NEX | 14.1% | -76.7% | -81% |
| KAZ Minerals | KAZ | 13.9% | 13.1% | -17% |
| Bunzl | BNZL | 13.6% | 12.8% | -9% |
| Serco | SRP | 13.5% | 1.6% | 25% |
| Focusrite | TUNE | 13.2% | 20.3% | 46% |
| Premier Foods | PFD | 12.4% | 14.4% | 19% |
| Rathbone Brothers | RAT | 12.2% | -9.4% | -25% |
| Connect Group | CNCT | 12.1% | 12.1% | -5% |
| Ferrexpo | FXPO | 11.7% | 21.5% | -51% |
| Picton Property Income | PCTN | 11.7% | 11.3% | 7% |
| Civitas Social | CSH | 11.0% | 10.4% | 3% |
| Tatton Asset Management | TAM | 10.8% | 10.8% | 12% |
| Glencore | GLEN | 10.8% | -37.0% | -80% |
| Associated British Foods | ABF | 10.6% | -25.3% | -45% |
| Barclays | BARC | 10.4% | -79.2% | -93% |
| Pan African Resources | PAF | 10.1% | 14.7% | 95% |
| Cranswick | CWK | 10.0% | 10.2% | 25% |
| Brooks MacDonald Group | BRK | 10.0% | -5.2% | 3% |
| Liontrust Asset Mgmt | LIO | 9.9% | 11.0% | 12% |
| M&G | MNG | 9.8% | 2.6% | - |
| Ascential | ASCL | 9.7% | -54.2% | -75% |
| Games Workshop Group | GAW | 9.5% | 11.3% | 6% |
| B&M European Value Retail | BME | 9.3% | 37.3% | 30% |
| G4S | GFS | 8.2% | -23.8% | -41% |
| Caledonia Mining | CMCL | 7.5% | 51.2% | 202% |
| Rio Tinto | RIO | 7.4% | 10.4% | -22% |
| GlobalData | DATA | 6.9% | 6.9% | 29% |
| Impact Healthcare | IHR | 6.9% | 9.3% | - |
| UNITE Group | UTG | 6.5% | -19.1% | -42% |
| Jupiter Fund Management | JUP | 5.9% | 0.6% | -28% |
| Urban Logistics REIT | SHED | 5.9% | -10.8% | -9% |
| EVRAZ | EVR | 5.8% | -6.8% | -59% |
| Nucleus Financial Group | NUC | 5.6% | -13.7% | -36% |
| Gem Diamonds | GEMD | 5.6% | -59.7% | -78% |
| Water Intelligence | WATR | 5.6% | 6.1% | 13% |
| Empiric Student | ESP | 5.1% | -42.4% | -48% |
| Marlowe | MRL | 5.0% | 5.0% | 7% |
| Persimmon | PSN | 4.8% | -13.2% | -30% |
| Central Asia Metals | CAML | 4.7% | -9.0% | -40% |
| Polymetal International | POLY | 4.7% | 13.3% | 63% |
| Midwich Group | MIDW | 4.5% | 4.5% | -1% |
| Oxford Instruments | OXIG | 4.3% | -19.9% | -25% |
| Centamin | CEY | 4.2% | 145.7% | 128% |
| Palace Capital | PCA | 4.1% | -18.6% | -24% |
| Drax Group | DRX | 4.0% | -2.0% | 20% |
| Brewin Dolphin | BRW | 3.9% | -4.6% | -10% |
| Impax Asset Management Gp | IPX | 3.8% | 7.5% | 23% |
| Computacenter | CCC | 3.5% | 4.1% | 13% |
| Chesnara | CSN | 3.4% | -39.4% | -1% |
| Schroders | SDR | 3.4% | 2.8% | -16% |
| Premier Miton Group | PMI | 3.4% | 11.0% | -22% |
| Epwin Holdings | EPWN | 3.3% | 11.7% | 7% |
| Smart Metering Systems | SMS | 3.3% | -5.5% | -45% |
| St James's Place | STJ | 3.3% | -1.7% | 2% |
| Smiths Group | SMIN | 3.3% | -1.0% | -13% |
| RBG Holdings | RBGP | 3.2% | 16.1% | 26% |
| Highland Gold Mining | HGM | 3.2% | -3.4% | 50% |
| Telecom Plus | TEP | 3.1% | -4.6% | -7% |
Souce: FactSet
| Downgrades | ||||
| Wednesday, 15 July 2020 | FWD EPS CHG | |||
| Name | TIDM | 1mth | 3mth | 1yr |
| Arbuthnot Banking Group | ARBB | -87.6% | -87.8% | -85% |
| ULS Technology | ULS | -84.2% | -84.2% | -86% |
| Nexus Infrastructure | NEXS | -80.7% | -82.5% | -75% |
| BP | BP | -80.4% | -97.3% | -99% |
| Hunting | HTG | -78.7% | -93.5% | -98% |
| Halfords Group | HFD | -78.5% | -76.9% | -80% |
| Speedy Hire | SDY | -78.5% | -78.5% | -79% |
| Renewi Plc | RWI | -71.9% | -68.1% | -74% |
| Forterra Plc | FORT | -69.3% | -79.2% | -83% |
| Renold | RNO | -68.7% | -68.7% | -84% |
| Scapa Group | SCPA | -65.7% | -67.9% | -75% |
| JD Sports Fashion | JD | -65.6% | -65.5% | -64% |
| Wincanton | WIN | -63.8% | -63.5% | -63% |
| Senior | SNR | -60.3% | -74.2% | -91% |
| PageGroup | PAGE | -60.0% | -80.8% | -90% |
| 1pm | OPM | -59.6% | -57.4% | -63% |
| HML | HMLH | -53.2% | - | -53% |
| First Property Group | FPO | -52.2% | - | -52% |
| McCarthy & Stone | MCS | -52.0% | -57.9% | -78% |
| N Brown Group | BWNG | -51.9% | -52.4% | -60% |
| Shanta Gold | SHG | -50.0% | -49.7% | -11% |
| Breedon Grp | BREE | -48.7% | -61.2% | -63% |
| NewRiver REIT | NRR | -48.6% | -51.9% | -52% |
| Griffin Mining | GFM | -48.3% | -48.0% | -54% |
| Norcros | NXR | -47.5% | -50.0% | -58% |
| Kenmare Resources | KMR | -45.1% | -47.5% | -70% |
| Hochschild Mining | HOC | -45.1% | -68.5% | -61% |
| Savills | SVS | -45.0% | -45.6% | -41% |
| MJ Gleeson | GLE | -43.2% | -80.0% | -87% |
| MITIE Group | MTO | -43.0% | -42.5% | -51% |
| Polypipe Group | PLP | -40.4% | -45.4% | -54% |
| D4t4 Solutions | D4T4 | -39.2% | -39.2% | -52% |
| InterContinental Hotels Group | IHG | -33.8% | -65.5% | -73% |
| Biffa Plc | BIFF | -33.1% | -80.1% | -82% |
| LSL Property Services | LSL | -32.3% | -32.3% | -47% |
| Ibstock | IBST | -32.2% | -60.2% | -70% |
| Tyman | TYMN | -31.8% | -51.1% | -55% |
| Ashtead Group | AHT | -31.5% | -36.7% | -41% |
| Auto Trader Group | AUTO | -31.3% | -31.1% | -33% |
| 4Imprint Group | FOUR | -30.5% | -80.3% | -86% |
| Secure Income REIT | SIR | -30.0% | -30.0% | -50% |
| Record | REC | -27.7% | -28.5% | -3% |
| Mediclinic International | MDC | -27.1% | -54.2% | -54% |
| Advanced Medical Sol Grp | AMS | -27.0% | -31.2% | -42% |
| Virgin Money UK | VMUK | -26.8% | -72.6% | -86% |
| Taylor Wimpey | TW | -26.6% | -44.0% | -53% |
| Capital & Counties Props | CAPC | -26.5% | -64.1% | -58% |
| Costain Group | COST | -26.5% | -46.1% | -74% |
| Petrofac | PFC | -25.5% | -44.5% | -65% |
| Crest Nicholson | CRST | -25.5% | -45.3% | -68% |
| GB Group | GBG | -25.3% | -24.2% | -22% |
| STV Group | STVG | -25.2% | -38.0% | -38% |
| DS Smith | SMDS | -24.5% | -24.8% | -31% |
| Melrose Industries | MRO | -24.3% | -61.6% | -80% |
| Intu Properties | INTU | -23.8% | -46.7% | -76% |
| Capita | CPI | -23.6% | -36.9% | -52% |
| Kier Group | KIE | -23.4% | -31.6% | -64% |
| Redrow | RDW | -23.3% | -35.2% | -45% |
| Severfield | SFR | -22.9% | -22.9% | -20% |
| discoverIE Group | DSCV | -21.3% | -19.4% | -26% |
| Burford Capital | BUR | -21.1% | -9.1% | -35% |
| Kin and Carta | KCT | -20.8% | -20.8% | -45% |
| McKay Securities | MCKS | -20.6% | - | -26% |
| Trifast | TRI | -20.3% | -23.6% | -43% |
| Go-Ahead Group | GOG | -20.2% | -53.8% | -60% |
| Shaftesbury | SHB | -20.2% | -36.1% | -48% |
| Braemar Shipping Services | BMS | -18.9% | -18.9% | -15% |
| Bushveld Minerals | BMN | -18.6% | -18.6% | -60% |
| Bank of Georgia Group | BGEO | -18.5% | -33.4% | -42% |
| Anexo Group | ANX | -18.0% | -18.9% | -9% |
| Calisen | CLSN | -17.6% | - | - |
| Capital & Regional | CAL | -17.0% | -39.8% | -65% |
| Kingfisher | KGF | -16.7% | -16.2% | -24% |
| Inspiration Healthcare Gp | IHC | -16.7% | -11.1% | 0% |
| Barratt Developments | BDEV | -16.0% | -29.4% | -37% |
| Vistry Group | VTY | -15.7% | -27.2% | -32% |
| RPS Group | RPS | -15.7% | 1.8% | -50% |
| Air Partner | AIR | -15.5% | 24.5% | -12% |
| TalkTalk Telecom Group | TALK | -15.3% | 2.5% | -11% |
| Marshalls | MSLH | -14.9% | -27.6% | -35% |
| Tekmar Group Plc | TGP | -14.4% | -14.4% | -52% |
| FRP Advisory Group | FRP | -13.8% | - | - |
| GCP Student Living | DIGS | -13.7% | -24.8% | -29% |
| TBC Bank Group | TBCG | -13.5% | -51.3% | -50% |
| Dixons Carphone | DC | -13.5% | -20.5% | -39% |
| Howden Joinery Group | HWDN | -13.5% | -45.4% | -43% |
| Pets At Home | PETS | -12.7% | -30.9% | -24% |
| Rightmove | RMV | -12.4% | -30.0% | -42% |
| Aggreko | AGK | -12.3% | -35.2% | -46% |
| Standard Chartered | STAN | -12.3% | -52.7% | -62% |
| Vivo Energy | VVO | -12.2% | -45.1% | -50% |
| Volex | VLX | -12.2% | - | 12% |
| Beazley | BEZ | -12.1% | -89.6% | -92% |
| Informa | INF | -11.8% | -46.6% | -60% |
| Tesco | TSCO | -11.4% | -25.7% | -22% |
| Centrica | CNA | -11.3% | -37.4% | -57% |
| Intermediate Capital Grp | ICP | -11.1% | -18.6% | -26% |
| Warehouse REIT | WHR | -11.0% | -10.9% | 14% |
| Network International Holdings | NETW | -10.8% | -46.1% | -48% |
| Countryside Properties | CSP | -10.5% | -35.6% | -37% |
| Lloyds Banking Group | LLOY | -10.5% | -59.5% | -81% |
| Lancashire | LRE | -10.2% | -31.8% | -34% |
| Paragon Banking Group | PAG | -10.2% | -20.1% | -35% |
| Vodafone Group | VOD | -10.2% | 8.7% | -5% |
| Morgan Advanced Materials | MGAM | -10.1% | -14.2% | -30% |
| First Derivatives | FDP | -10.0% | -31.0% | -32% |
| Close Brothers Group | CBG | -10.0% | -36.0% | -44% |
| 1Spatial | SPA | -9.6% | 15.3% | 17% |
| Litigation Capital Mgmt | LIT | -9.4% | -3.0% | 27% |
| Victrex | VCT | -9.4% | -20.9% | -29% |
| Hill & Smith | HILS | -9.1% | -19.9% | -33% |
| Medica Group | MGP | -9.1% | -14.9% | -34% |
| Hays | HAS | -9.0% | -31.8% | -68% |
| AEW UK REIT | AEWU | -9.0% | -9.0% | -9% |
| Restore | RST | -8.5% | -36.7% | -41% |
| Phoenix Group Holdings | PHNX | -8.4% | -14.2% | 17% |
| WPP | WPP | -8.3% | -22.9% | -45% |
| Moneysupermarket com Grp | MONY | -8.1% | -17.7% | -18% |
| Bodycote | BOY | -7.7% | -16.0% | -46% |
| Abcam | ABC | -7.7% | -20.4% | -39% |
| Nichols | NICL | -7.7% | -25.9% | -35% |
| Meggitt | MGGT | -7.6% | -33.6% | -45% |
| Man Group | EMG | -7.4% | -5.4% | -25% |
| SSE | SSE | -6.4% | -6.6% | -16% |
| Porvair | PRV | -6.3% | -15.4% | -22% |
| Morses Club | MCL | -6.2% | -10.9% | -24% |
| Avingtrans | AVG | -5.9% | -5.9% | 19% |
| Curtis Banks Group | CBP | -5.9% | -5.9% | -17% |
| Morgan Sindall Group | MGNS | -5.9% | -26.2% | -36% |
| Equiniti Group | EQN | -5.6% | -18.3% | -30% |
| Vectura Group | VEC | -5.6% | -7.3% | 17% |
| Inchcape | INCH | -5.5% | -50.9% | -59% |
| Smith & Nephew | SN | -5.4% | -27.4% | -33% |
| Clinigen Group | CLIN | -5.4% | -6.5% | 22% |
| Coats Group | COA | -5.1% | -45.1% | -71% |
| Essentra | ESNT | -5.1% | -15.1% | -40% |
| St Modwen Properties | SMP | -4.8% | -32.2% | -22% |
| Babcock International Group | BAB | -4.6% | -22.4% | -26% |
| National Grid | NG | -4.6% | -4.1% | -2% |
| AG BARR | BAG | -4.6% | -19.2% | -39% |
| Petropavlovsk | POG | -4.6% | 249.2% | 911% |
| HSBC Holdings | HSBA | -4.5% | -43.6% | -61% |
| Redde Northgate | REDD | -4.5% | -6.0% | -18% |
| Ricardo | RCDO | -4.3% | -25.3% | -38% |
| AB Dynamics | ABDP | -4.3% | -17.0% | -5% |
| Standard Life Aberdeen | SLA | -4.2% | -5.9% | -32% |
| Travis Perkins | TPK | -4.1% | -33.8% | -45% |
| Greencore Group | GNC | -4.0% | -56.7% | -54% |
| Science In Sport | SIS | -3.9% | -3.9% | - |
| Vesuvius | VSVS | -3.7% | -23.6% | -54% |
| Land Securities Group | LAND | -3.7% | -25.5% | -25% |
| Bellway | BWY | -3.5% | -17.5% | -35% |
| Rank Group | RNK | -3.3% | -36.9% | -36% |
| RELX | REL | -3.3% | -7.5% | -7% |
| CareTech | CTH | -3.3% | 2.5% | 15% |
| Johnson Matthey | JMAT | -3.1% | -25.2% | -38% |
| Diploma | DPLM | -3.1% | -9.5% | -11% |
| Domino's Pizza Group | DOM | -3.1% | -1.0% | 3% |
| British Land | BLND | -3.1% | -21.5% | -22% |
| Britvic | BVIC | -3.1% | -15.3% | -29% |
| Serica Energy | SQZ | -3.0% | -63.4% | -64% |
Souce: FactSet


