

Trying to implement 'expert' stocks screens can sometimes leave one feeling lost in a sea of formulas, ratios and data while struggling to stay focused on the screen's underlying investment logic. Not so with the 'Magic Formula' stock screen devised by hedge-fund star Joel Greenblatt. Indeed, the screen is based on a simple concept, just two ratios and, what's more, in the two years we've published portfolios based on the methodology the results have been excellent (see table).
| Company | TIDM | Total return (26 Jan 2011 - 8 Feb 2012) | Company | TIDM | Total return (8 Feb 2012 - 4 Feb 2013) |
|---|---|---|---|---|---|
| Education Development International | EDI | 75.98% | Impellam | IPEL | 41.68% |
| JD Sports Fashion | JD. | -4.78% | Xchanging | XCH | 55.06% |
| AstraZeneca | AZN | 3.62% | Alliance Pharma | APH | 8.15% |
| JKX Oil &Gas | JKX | -50.53% | Pace | PIC | 169.53% |
| Pan African Resources | PAF | 87.65% | Anglo Asian | AAZ | 11.45% |
| Andrew Sykes | ASY | 12.34% | Astrazeneca | AZN | 8.34% |
| Paypoint | PAY | 69.40% | UTV Media | UTV | 22.59% |
| Next | NXT | 35.10% | WS Atkins | ATK | 18.39% |
| Timeweave | TMW | 15.00% | GVC | GVC | 94.16% |
| FW Thorpe | TFW | 15.44% | Ferrexpo | FXPO | -23.57% |
| Matchtech | MTEC | -6.87% | JD Sports Fashion | JD. | -3.66% |
| EAGA | EAGA | 67.39% | Halfords | HFD | 16.34% |
| Anglo-Eastern Plantations | AEP | -2.25% | Immunodiagnostic Systems | IDH | -22.06% |
| China Shoto | CHNS | 29.23% | William Hill | WMH | 76.00% |
| Sportingbet | SBT | -15.38% | Logica | LOG | 31.88% |
| Howden Joinery | HWDN | -5.57% | Howden Joinery | HWDN | 71.82% |
| Pace | PIC | -53.20% | Valiant Petroleum | VPP | -2.66% |
| WH Smith | SMWH | 11.55% | Gemfields | GEM | 35.19% |
| Jetion Solar | JHL | 0.00% | Qinetiq | QQ. | 44.55% |
| Halfords | HFD | -16.75% | Laura Ashley | ALY | 41.70% |
| Alternative Networks | AN. | 58.86% | Anglo Pacific | APF | -7.46% |
| Alliance Pharma | APH | -6.92% | WH Smith | SMWH | 36.66% |
| Laura Ashley | ALY | -6.10% | Next Fifteen Communications | NFC | 8.83% |
| Micro Focus International | MCRO | 9.93% | XP Power | XPP | 16.40% |
| Greggs | GRG | 19.03% | Clarkson | CKN | 25.49% |
| Griffin Mining | GFM | -31.88% | Gulfsands Petroleum | GPX | -37.70% |
| Robert Wiseman Dairy | RWD | 21.79% | KCOM | KCOM | 11.77% |
| James Halstead | JHD | 20.12% | BHP Billiton | BLT | 7.85% |
| BHP Billiton | BLT | -10.39% | Andrew Sykes | ASY | 12.44% |
| GlaxoSmithKline | GSK | 10.15% | |||
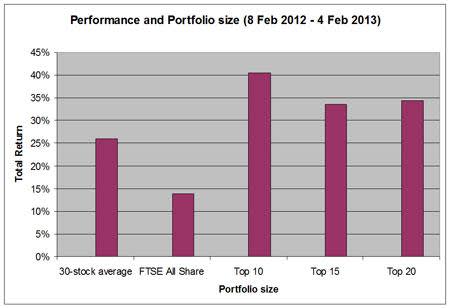
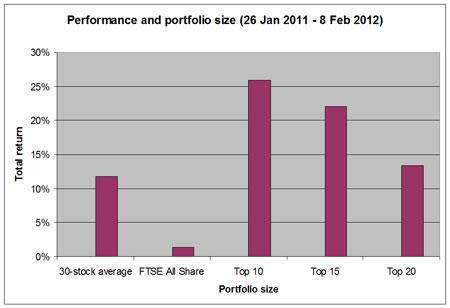
| Average | 11.79% | Average | 25.98% | ||
| FTSE All-Share | 1.40% | FTSE All-Share | 13.77% |
Source: Datastream
The magic formula was expounded by Mr Greenblatt in his very readable, concise and aptly-titled investment guide, 'The Little Book That Beats The Market'. His aim in writing the book was to set out a simple, market-beating investment strategy that people could use to generate outperformance with little investment knowledge and time. In fact, he had his own kids in mind when he penned it.
Not only is the screening method simple, but the concept is also clear enough for an investment novice to grasp with little difficulty. Mr Greenblatt's formula is simply interested in looking for the highest-quality companies at the lowest prices.
The performance generated by our screen tallies with the impressive results Mr Greenblatt found the formula had achieved in the 17 years between 1988 and 2004. Over that time it produced a return of 30.8 per cent a year compared with 12.4 per cent from the S&P 500. But Mr Greenblatt found that the returns generated by his screen were not smooth and he advocated that only by people who are prepared to stick with it through the bad times as well as the good should use it.
To reduce the risks associated with the approach, Mr Greenblatt advocates running a portfolio of between 20 and 30 stocks. This may be a little too many holdings for some investors to consider. We've found with our own screens that the returns from smaller portfolios based on the top ranking 10 or 15 stocks have actually outperformed over the last two year. But the risks are inevitably higher the fewer the stocks held and, as the above performance tables demonstrate, there can be a wide variation between the way individual stocks perform.
Mr Greenblatt believes the best way to build up a portfolio is to buy a handful of the highest-ranked stocks from the screen each month so that the entire portfolio is assembled over a year (given the limits of column inches, we only offer an annual selection of 30 Greenblatt share picks). Mr Greenblatt suggests holding periods of a year, but we've found many of the stocks favoured by past screens have a tendency to recur.
Where some complexities do come into the Greenblatt approach is in the precise definition of the ratios used. In essence, the metrics Mr Greenblatt uses to identify stocks to buy are permutations on the commonly-used price-earnings (PE) and the return-on-capital (RoC) ratios. But the amendments Mr Greenblatt suggests to these ratios illustrate what a sage investor he is, as his small changes do really hone in on what counts when it comes to evaluating a stock as an investment. The two measures for value and quality are as follows.
VALUATION
The PE variant used by Greenblatt is actually an earnings yield (EY). Conventionally EY is a PE ratio flipped on its head to express EPS as a percentage of share price. In order to focus on the underlying performance, Mr Greenblatt focuses on a company's earnings before interest and tax (EBIT) rather than 'bottom-line' earnings - after tax and interest. He also thinks it is important to take account of net debt or cash in the overall value being given to a company. So his EY expresses EBIT as a percentage of enterprise value (EV), which is market capitalisation plus debt and minus cash.
QUALITY
To measure the quality of a business, Mr Greenblatt looks at EBIT as a percentage of tangible assets employed. Again, the re-jigged measure tries to wheedle down to what is really going to matter to an investment decision. EBIT is used to give a clearer picture of the profits being generated from the company's actual operations. The tangible asset measure, which consists of net working capital added to net fixed assets, also has a focus on the assets that are actually being used in the company's operations in order to create its profits. Focusing on tangible assets helps avoid the type of balance sheet items that can relate more to a company's past than present. Due to the make up of financial companies' balance sheets, such stocks are excluded from the screen.
We've used Mr Greenblatt's magic formula to screen every non-financial company on the Main Market and Aim with a market capitalisation of more than £50m. The screen works by giving every stock a ranking for value based on Mr Greenblatt's EY measure and then a ranking for quality based on the RoC measure. These rankings are added together and then ranked according to best combined ranking. The top 30 stocks are listed in our table below along with some fundamental data. As this stock-picking exercise is meant as an end in itself rather than a process that leads to deeper analysis, we have opted against taking a closer look at any of the stocks coming through the screen, as we would otherwise do.
MAGIC STOCKS
| Company | TIDM | Market cap | Price | Forecast PE ratio | DY | Forecast EPS growth | P/ TangBV | Net Debt/ Cash | RANK |
|---|---|---|---|---|---|---|---|---|---|
| Creston | LSE:CRE | £53m | 88p | 7.3 | 4.0% | -7.8% | 30 | -£0.1m | 1 |
| UTV Media | LSE:UTV | £134m | 141p | 8.4 | 4.3% | -14% | - | -£55m | 2 |
| Gemfields | AIM:GEM | £148m | 27p | 13 | - | - | 0.89 | £22m | 3 |
| Impellam | AIM:IPEL | £149m | 335p | - | - | 22% | 5.1 | £1.8m | 4 |
| Xchanging | LSE:XCH | £294m | 122p | 12 | - | 48% | - | £46m | 5 |
| Naibu (China) | AIM:NBU | £58m | 105p | 2.1 | - | - | 0.68 | £29m | 6 |
| Chime Comm. | LSE:CHW | £193m | 240p | 11 | 2.8% | -19% | - | £3.3m | 7 |
| M&C Saatchi | AIM:SAA | £130m | 205p | 13 | 2.2% | 10% | - | £15m | 8 |
| AstraZeneca | LSE:AZN | £38bn | 3,069p | 8.9 | 5.6% | - | - | -£1.1bn | 9 |
| Brightside | AIM:BRT | £98m | 22p | 7.2 | - | 57% | 11 | -£16m | 10 |
| HomeServe | LSE:HSV | £764m | 236p | 11 | 4.8% | -16% | - | -£66m | 11 |
| WS Atkins | LSE:ATK | £802m | 822p | 10 | 3.7% | -1.2% | - | £98m | 12 |
| Alternative Networks | AIM:AN. | £115m | 270p | 12 | 4.3% | 0.5% | 10 | £21m | 13 |
| GVC | AIM:GVC | £83m | 264p | - | 6.6% | - | - | £5.8m | 14 |
| WH Smith | LSE:SMWH | £823m | 673p | 10 | 4.0% | 12% | 8.9 | £36m | 15 |
| QinetiQ | LSE:QQ. | £1.3bn | 198p | 12 | 1.5% | 17% | 54 | -£130m | 16 |
| Anglo Asian Mining | AIM:AAZ | £52m | 46p | - | - | - | 1.4 | -£2.1m | 17 |
| Alliance Pharma | AIM:APH | £78m | 32p | 10 | 2.5% | -7.6% | - | -£23m | 18 |
| Go-Ahead | LSE:GOG | £563m | 1,315p | 10 | 6.2% | -8.0% | - | -£85m | 19 |
| Coastal Energy Company | AIM:CEO | £1.6bn | 1,408p | 10 | - | 304% | 7.0 | -£35m | 20 |
| Cable &Wireless Comms | LSE:CWC | £1.0bn | 41p | 11 | 12.3% | -7.6% | - | -£862m | 21 |
| Gable | AIM:GAH | £54m | 48p | 6.6 | 0.0% | 89% | 4.6 | £12m | 22 |
| Vp | LSE:VP. | £122m | 318p | 10 | 3.6% | 8.9% | 2.1 | -£40m | 23 |
| MDM Engineering | AIM:MDM | £66m | 179p | 10 | 2.7% | 91% | 4.4 | £18m | 24 |
| Next Fifteen Comms | AIM:NFC | £60m | 101p | 9.4 | 2.3% | 6.4% | - | -£2.6m | 25 |
| Amara Mining | AIM:AMA | £89m | 53p | 11 | - | -71% | 3.8 | £19m | 26 |
| KCOM | LSE:KCOM | £397m | 77p | 10 | 5.2% | 6.9% | - | -£79m | 27 |
| Ebiquity | AIM:EBQ | £54m | 97p | 11 | - | 18% | - | -£12m | 28 |
| Afren | LSE:AFR | £1.7bn | 154p | - | - | 148% | 5.0 | -£439m | 29 |
| Immuno-diagnostic Sys. | AIM:IDH | £85m | 300p | 10 | 0.9% | -16% | 3.7 | £6.9m | 30 |
Source S&P Capital IQ


