

When writing this column my presumption is that most readers, if they find the screens useful, will generally be interested in the stocks highlighted as a source of ideas for further research rather than as portfolios for wholesale take-up. But within the gamut of screens I follow, some are definitely more suited to generating ideas than anything else, while the odd one is designed as a fait accompli (Joel Greenblatt's Magic Formula, for example, was designed as a stockpicking system that his children could follow to the letter). This week's screen falls very much into the idea-generation camp. Indeed, I've composed the screen specifically to generate ideas for our occasional feature that we're calling The Cash Clinic, which we kicked off in July with a look at Marks and Spencer (MKS).
The purpose of the Cash Clinic is to look at stocks that seem to be either far more or less attractive based on an analysis of cash flow rather than earnings. The reasoning behind this is that there is arguably a general tendency among investors to let cash flow analysis play second fiddle to earnings analysis. That should present opportunities for cash-focused investors to unearth overlooked treasures. Intuitively the relative lack of attention given to cash seems a bit odd given it is ultimately the lifeblood of any business.
But there is one very good reason that investors don't rely more heavily on cash flow analysis, which is that often the stories told by cash flow statements are far more difficult to understand and interpret than the narrative found in income statements. Indeed, the message from cash flow can often seem extremely confused.
While the cash flow statement provides an overview of the commercial reality of a company's financial year, it is the story told by the profit-and-loss account that attempts to give investors an insight into the commercial logic of what a company is up to (sometimes this logic can be cast in an excessively flattering light). For example, a decision to invest in a new factory may be made on the basis that it will be run for the next 20 years. The logic of this can be reflected in the profit-and-loss account by depreciating the asset and charging it against revenues over that period. In the cash flow statement, though, the reality of building the factory will be shown as a one-off hit in the period the investment occurs, which will crush cash flow.
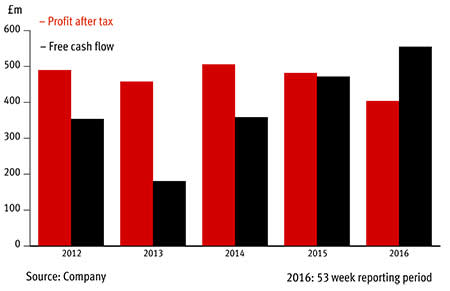
Take our friend M&S (MKS). Our interest was piqued by the fact that, despite three years of falling post-tax profits and much publicised difficulties with clothing sales, cash flows are soaring and the company is not only raising its generous dividend but also making special payments.
M&S free cash flow vs profit after tax
M&S free cash flow and cash returns
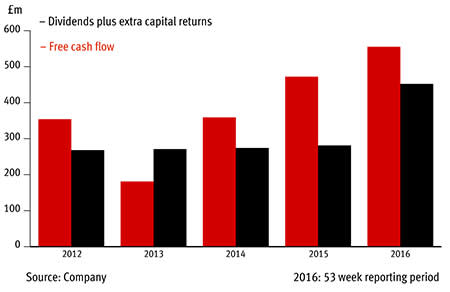
Key to this seeming contradiction between profit and cash flow is the fact that M&S invested heavily over a number of years in its stores, distribution and IT. But more recently these projects have been winding down. What's more, the company's chief executive has changed this year and the new man at the top, Steve Rowe, has signalled a desire to rein in capital expenditure and make cash generation a focus. So the company indeed looks a lot more attractive on the basis of cash flows than profits. That said, our long-term analysis of the company's cash flows gave grounds to question just how long capital expenditure can really be kept down for. There is also the big question of whether the decline in clothing sales can ever be reversed.
Trading uncertainties aside, there are good grounds to argue that when cash flows are clearly more attractive than profits, it is significant for investors who may well get to share in the bounty through things such as special dividends, buybacks or earnings-enhancing acquisitions (presuming deals are sensible ones). And strong cash generation can also be an indicator that the quality of a company's earnings are higher than they first appear, which may ultimately be recognised by an upward re-rating of the shares.
Cash flows are also often hard to read because of seeming erratic movements in working capital (the amount of cash tied up in the day-to-day operations of a business) due to simple changes to the timing of payments both to the company and to its suppliers. There can be many very straightforward reasons for what can appear alarming working capital movements, such as stock building ahead of a factory refit, for example. But trends in working capital movements that are not fully explained by business growth are always worth investigating. For instance, substantial drains on cash from receivables (bills unpaid by customers) can be an important red flag, as can persistently rising stock levels, which can often suggest a company is sitting on unsellable goods. Confusingly, increased cash generation from working capital can also sometimes prove a warning sign. For example, companies that persistently lengthen the amount of time they take to pay suppliers (boosting cash flow by increasing 'payables') can come a cropper if suppliers are forced to revolt or buckle - think Tesco.
Aside from the inherent vagaries of the raw numbers in the cash flow statement, the other key reason I'd regard this week's screen as primarily an exercise in idea generation is that aside from asking about the quality of cash generation, the screen isn't interested in asking about either the overall quality of the companies it is screening or the valuation of their shares. Indeed, an overvalued, low-quality business may well prove a poor investment even if cash generation is very good. Not least because if a business is making a low return on its assets and sales, cash generation may not remain good for that long.
The nuts and bolts of my Cash Clinic screen are to look for stocks that look better or worse on a number of cash flow measures than they do on equivalent earnings measures. The stocks can score up to five plus points for each of the positive screen tests they pass and up to five minus points for each negative test. The tests, which have been conducted on all listed companies with a market cap of £10m or more, are as follows.
Cash flow positives
■ Lease-adjusted cash return on capital invested (CROCI) more than lease-adjusted return on capital employed (ROCE). Note, this is the same as free cash conversion of over 100 per cent in the current year. ■ Three-year average free cash conversion (free cash flow per share (FCF)/earnings per share(EPS))of over 100 per cent. ■ Rising free cash flow in each of the past three years. ■ Three-year average operating cash conversion (operating cash flow/operating profit) of over 100 per cent. ■ Rising operating cash conversion in each of the past three years. |
Cash flow negatives
■ Lease-adjusted cash return on capital invested (CROCI) less than half the earnings equivalent of lease-adjusted return on capital employed (ROCE). Note, this is the same as free cash conversion of less than 50 per cent in the current year. ■ Three-year average free cash conversion of less than 75 per cent. ■ Falling free cash flow in each of the past three years. ■ Three-year average operating cash conversion of less than 75 per cent. ■ Falling operating cash conversion in each of the past three years. |
The key difference between operating cash and free cash flow (FCF) is that the former looks at cash generation before investment in the business, along with some other necessary cash costs such as interest payments and tax. FCF takes these factors into account to give a view of what cash is available from a financial year to distribute to shareholders in the form of dividends or to spend on things like acquisitions. FCF can be calculated to only include the investment spending needed to maintain a business. However, in practice it is very hard to separate out maintenance and expansionary capital expenditure. In this screen the data, which is from Ionic Information (the company behind the Sharepad and Sharescope products), strips out all capital expenditure, which I personally think is the most straightforward and commonsense approach.
When interpreting the results from the screen, especially the negative results, it's important to bear in mind that a lot of what this screen is picking up on is simply the characteristics of certain industries. Indeed, among the companies racking up big negative scores, there is a preponderance of capital-intensive businesses in growth mode. If one believes prospects for these industries will remain healthy for some time, then it can be seen as a good thing that companies are pumping plenty of cash into growth.
The trouble for many companies in investment-hungry, cyclical industries - and a key reason their shares struggle to command high ratings - is that they have long capital investment cycles, which mean a sharp and unforeseen turn in the market can decimate the returns they generate from earlier spending. This is a classic problem housebuilders face, for instance. Such companies made a big showing among this screen's big negative-point scorers, although only one came in with a -5 score. This observation comes with a twist, because the difficulty with managing investment over the cycle is also one of the main reasons so many housebuilders are currently keen to hand capital back to shareholders while conditions are good rather than reinvesting and adding too greatly to balance-sheet risk. So ironically, the large amount of cash these companies have to tie up to grow has made them a great place to go recently for cash returns as they try to mitigate the inherent dangers of the business model.
The two tables below give details of those companies that scored either a top score of plus five on the screen's tests or a bottom score of minus five. Mark and Spencer, which we feel was a good subject for our first Cash Clinic, scored plus three, and GlaxoSmithKline, which we plan to feature in our next Cash Clinic scored minus three. If readers are interested in us wheeling any specific company from the tables below into our Cash Clinic, or any company they think has particularly noteworthy cash characteristics, please let us know and we'll see what we can do.
Plus fivers
| Name | TIDM | Price | Mkt cap | Net debt/ ebitha | Lease-adj CROCI | Lease-adj ROCE | P/ FCF | PE | Fwd NTM PE | DY | Fwd NTM DY | Dividend cov | FCF div cov |
|---|---|---|---|---|---|---|---|---|---|---|---|---|---|
| Mattioli Woods | MTW | 683p | £171m | -2.3 | 13% | 11% | 19.9 | 30.4 | - | 1.8% | - | 1.8 | 2.7 |
| William Hill | WMH | 299p | £2.6bn | 1.1 | 14% | 11% | 11.2 | 15 | 13.7 | 4.2% | 4.2% | 1.6 | 2.1 |
| Waterman | WTM | 81.0p | £25m | -1.3 | 11% | 7.6% | 6.8 | 14.7 | 10.5 | 2.4% | 3.7% | 2.8 | 6 |
| Midwich | MIDW | 243p | £193m | 2 | 24% | 17% | 12.7 | 40.5 | 15.5 | - | 3.0% | - | - |
| CRH | CRH | 25,165p | £21bn | 2.8 | 7.5% | 6.8% | 19.7 | 34.1 | 18.2 | 1.8% | 2.2% | 1.6 | 2.8 |
| Taptica | TAP | 158p | £98m | -5.7 | 8.6% | 6.9% | 39.8 | 70 | 10.1 | 0.3% | 1.8% | 4.2 | 7.4 |
| Synectics | SNX | 194p | £35m | -0.2 | 13% | 3.0% | 5.5 | 77.6 | 17.8 | 0.5% | 1.5% | 2.5 | 35 |
| Majestic Wine | WINE | 415p | £293m | 1.6 | 7.2% | 5.8% | 42.1 | 224.7 | 24.5 | - | 1.4% | - | - |
| IG Design | IGR | 261p | £167m | 1.1 | 13% | 12% | 13.3 | 21.7 | 18.7 | 0.9% | 1.3% | 4.9 | 8.1 |
| Softcat | SCT | 335p | £652m | -1.7 | 52% | 47% | 14.5 | 20.2 | 18.1 | - | 1.2% | - | - |
| Learning Technologies | LTG | 31.8p | £133m | -2 | 15% | 9% | 36.4 | 72.2 | 28.9 | 0.5% | 0.6% | 2.9 | 5.8 |
| Ideagen | IDEA | 57.0p | £100m | -1.2 | 7.5% | 2.8% | 37.1 | 77.9 | 17.9 | 0.3% | 0.4% | 3.9 | 8.2 |
| Advanced Medical Solutions | AMS | 232p | £494m | -1.7 | 17% | 16% | 26.8 | 35.2 | 31.8 | 0.3% | 0.4% | 8.3 | 11 |
Minus fivers
| Name | TIDM | Price | Mkt cap | Net debt/ ebitha | Lease-adj CROCI | Lease-adj ROCE | P/FCF | PE | Fwd NTM PE | DY | Fwd NTM DY | Dividend cov | FCF div cov |
|---|---|---|---|---|---|---|---|---|---|---|---|---|---|
| Wincanton | WIN | 192p | £235m | 0.6 | 0.5% | 17% | -6.3 | 9.3 | 8.2 | 2.9% | 4.6% | 3.7 | -5.5 |
| Bellway | BWY | 2,236p | £2.7bn | 0.1 | 2.3% | 22% | 111.1 | 9.8 | 7.2 | 3.5% | 4.6% | 2.9 | 0.3 |
| Solid State | SOLI | 385p | £32m | 0.6 | 5.1% | 25% | 41.3 | 6.5 | 10.8 | 3.2% | 3.3% | 4.8 | 0.8 |
| SimiGon | SIM | 21.0p | £11m | -3.5 | -16% | 15% | -9.4 | 8 | 11.1 | 1.9% | 2.4% | 6.5 | -5.5 |
| HSS Hire | HSS | 76.5p | £119m | 3.2 | -2.4% | 6.8% | -2.5 | 219.3 | 14.5 | 1.5% | 1.7% | 0.3 | -27 |
| Gama Aviation | GMAA | 176p | £77m | 0.4 | -28% | 35% | -5.8 | 8.3 | 6.8 | - | 1.3% | - | - |
| Driver | DRV | 43.0p | £14m | 2.5 | -6.2% | 4.1% | -7.1 | 66.4 | - | 3.9% | - | 0.4 | -3.6 |
| Tanfield | TAN | 12.3p | £19m | 0.4 | -2.5% | 1.0% | -18.1 | 64.5 | - | - | - | - | - |
| Ensor | ESR | 67.5p | £20m | 0.2 | -22% | 12% | -5.3 | 15.4 | - | 3.4% | - | 1.9 | -5.5 |
| Stanley Gibbons | SGI | 13.9p | £27m | 1.6 | -10% | 6.5% | -0.6 | 1.7 | - | 33% | - | 1.8 | -5 |
| Sepura | SEPU | 11.6p | £44m | 4.8 | -20% | 5.4% | -0.6 | 2.1 | - | 6.6% | - | 7.3 | -24 |
| BP Marsh & Partners | BPM | 199p | £58m | -0.2 | 0.5% | 15% | 164.9 | 6.7 | - | 1.7% | - | 8.7 | 0.4 |
| Market Tech | MKT | 165p | £771m | 5.5 | -19% | 3.9% | -3.3 | 32.1 | >500 | - | - | - | - |
| Barloworld | BWO | 590p | £1.3bn | 1.7 | -10% | 10% | -5.3 | 13.6 | - | 2.9% | - | 2.5 | -6.4 |
| Symphony International | SIHL | 74.5c | $395m | -4.4 | -2.3% | 2.2% | -24.4 | 25.7 | - | 8.4% | - | 0.5 | -0.5 |
Source: Ionic Information/Sharepad


