The two key elements to building a successful portfolio are achieving superior returns and controlling risks. Technical analysis is an ideal tool for achieving each of these goals, while exchange traded funds (ETFs) are an ideal vehicle for gaining exposure to broad asset classes at low cost. Looking at charts of asset classes tracked by ETFs helps identify the most promising trends. Specifically, we want to buy into the early stages of major up-trends, particularly those most likely to stand the test of time. Let’s look at this process in action.
During generally bullish market conditions - where lots of different asset classes are rising simultaneously - we need to pick out the best-constructed trends. A trend that advances and then pulls back to its previous highs, before advancing again is a more reliable pattern than a straight-line upwards acceleration. This sort of activity is on display in the chart of the Turkish market ETF below.
Turkish delight

To have greater confidence in a trend, we should also look cases for where the daily, weekly and monthly charts are all in agreement. When the messages coming from all three are bullish - or at least not contradicting one another - the signals generated have much more significance. We either want to join a trend in its earliest confirmed stages, or as a bullish reversal pattern completes, or as a continuation pattern forms.
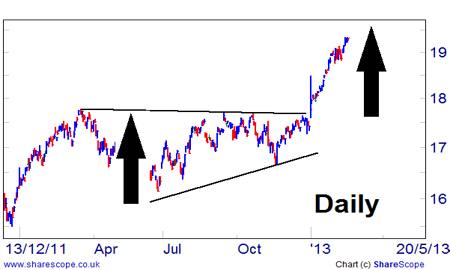
The big picture: MSCI World

In this weekly chart of the MSCI World index, for example, we can see that the market fails repeatedly to break above the 18 level. When it finally does, the previous powerful resistance level becomes strong support. By next inspecting the daily chart, we get confirmation that the move is probably, seeing that the price has broken upwards out of a classic continuation triangle pattern, from which we can also derive a price-target.
Up close: MSCI World
The next step is to compare the trend we are considering joining with those of rival bull markets. For example, how strong is the stock we’re considering buying relative to its sector? Or, how strong is a specific country's stock-market index compared with the regional or global index? We may then be faced with a choice between a well-constructed trend in an underperforming market and a less reliable-looking but more powerful trend.
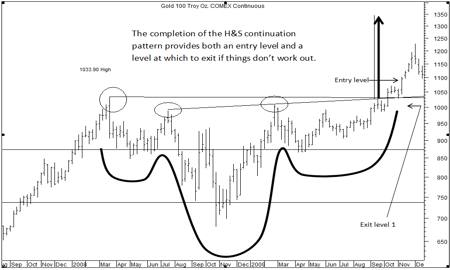
Having identified a tactical opportunity in this way, we can use the technical set-up to help determine the level of return that we seek, as well as for risk management. The essential point here is to recognise that apparently strong trends can fail, and to be ready to adjust our strategy accordingly. The decision to cut losses or to take profits should be taken at the point where the original set-up that prompted you to buy fails or where the market has completed the measured move associated with that pattern, as in this weekly chart of gold.
Entries and exits in gold