- There are many factors to consider with portfolio diversification
- It is prudent to be positioned for a range of possible scenarios
Portfolio diversification is financial planning 101. The objective is to allocate capital in a way that reduces exposure to any one particular asset or risk and lowers the volatility of your investment portfolio. The difficulty is working out how to balance diversification with attractive growth prospects.
There are many components to consider when checking you are adequately diversified, both across and within asset classes. Traditionally, investors would blend equities and bonds which were negatively correlated and had the effect of smoothing investment returns. As loose monetary policy since the global financial crisis has had the effect of inflating both bond and equity prices, the diversification attributes may not be as clear as they once were.
Asset allocation
Your allocation across asset classes depends on your risk appetite. Laith Khalaf, head of investment analysis at AJ Bell, suggests a strategic asset allocation of between 60 and 80 per cent invested in equities, with the remainder invested in bonds, cash and alternatives.
One way to check the diversification within a portfolio is to look at the correlation between asset classes. The table below shows the one year correlation of major equity indices with some traditional diversifiers, over one year. A correlation of 1 means assets uniformly rise and fall together, and a correlation of -1 represents inverse movements.
As you can see, the correlations between some key equity indices and certain asset classes, such as high yield and strategic bond funds as well as targeted absolute return funds, has been relatively high, meaning the diversification is not particularly strong.
Peter Sleep, senior investment manager at Seven Investment Management, says a common mistake he sees in investor portfolios is exposure to economically sensitive assets such as “buying some equity funds and, say, a commercial property fund and thinking you are diversified. In reality this portfolio has a big exposure to the economic cycle,” he says. Government bonds and cash are more likely to dampen losses in a downturn.
One-year asset correlations with equities | |||||||||
|---|---|---|---|---|---|---|---|---|---|
| Name | FTSE Actuaries UK Conventional Gilts | US 1 Year Treasury Bill | IA Sterling High Yield | IA Sterling Strategic Bond | IA Targeted Absolute Return | IA UK Direct Property | IA Property Other TR in GB | IT Property - UK Commercial | FTSE Gold Mines |
| FTSE All Share TR in GB | -0.05 | -0.53 | 0.85 | 0.67 | 0.95 | 0.00 | 0.87 | 0.72 | -0.11 |
| MSCI Emerging Markets TR in GB | -0.06 | -0.05 | 0.51 | 0.46 | 0.43 | -0.57 | 0.08 | 0.12 | -0.31 |
| S&P 500 in GB | 0.01 | -0.06 | 0.60 | 0.53 | 0.68 | 0.18 | 0.84 | 0.58 | -0.20 |
| Source: FE Analytics, 26.08.21, total returns in GBP | |||||||||
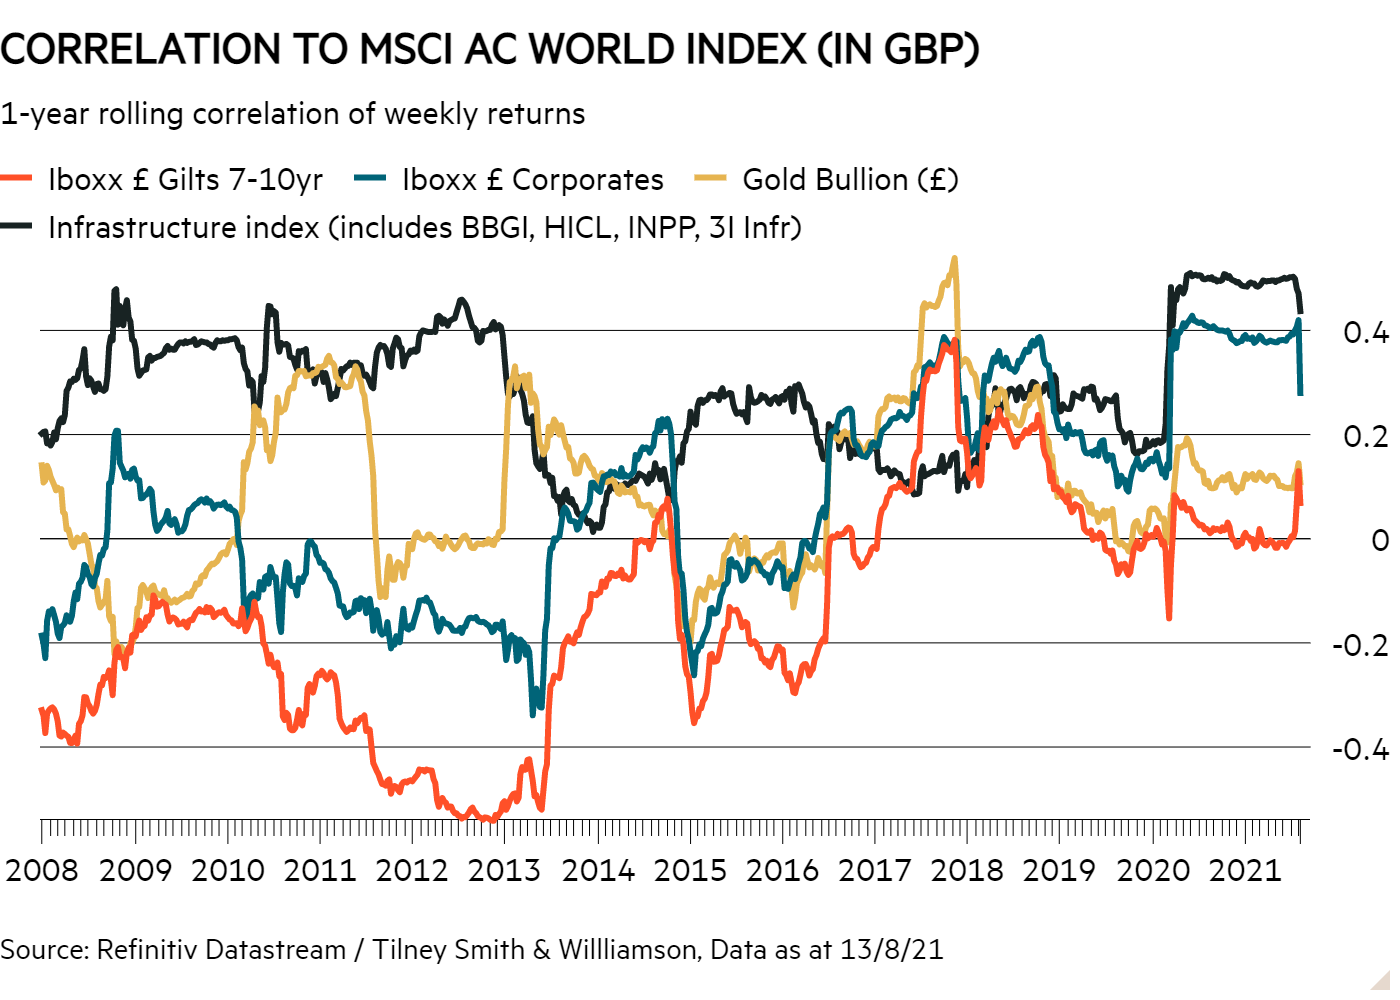
The chart below shows how correlations of a select group of asset classes to the MSCI AC World index have changed over time. It shows how correlations can be volatile, and also how they have tightened over the past decade. Infrastructure investment trusts show a distinct volatility in correlation levels, which is partly because they are affected by share price dynamics even if the underlying assets typically have a low correlation with equities.
Equities
Equities will probably make up the lion’s share of your portfolio, meaning it is important to diversify within this asset class. There are many ways to consider diversification: geographically, across sectors, across investment style (growth vs value) and via the size of companies held.
Emma Wall, head of investment analysis at Hargreaves Lansdown, says one of the most common portfolio mistakes she sees when it comes to building a diversified portfolio is a lack of style diversification. “Often we see a growth bias to investors’ portfolios that they should be mindful of,” she says. This is partly because growth stocks have performed much better than value stocks in aggregate over the past decade, which may have led to style biases within portfolios that investors aren’t aware of.
If inflation picks up, cyclical companies typically categorised as ‘value’ holdings may find this favourable, if it is fuelled by real economic growth. However, history suggests that if inflation runs hot (ie above 4 per cent for a long period of time) this would hurt all equities.
Kevin Boscher, chief investment officer at Ravenscroft, says the current outlook is very uncertain so his client portfolios have a blend of growth and value equities, with the highest risk clients owning up to 88 per cent of the portfolio in equities, and a 56 per cent allocation for medium risk clients.
He says inflation may be more persistent than we think, particularly in the US, where cyclical companies may prosper. However, we can’t rule out the possibility of deflation or disinflation, which was a concern as we came into the pandemic and would create an environment where government bonds and growth equities prosper.
Across geographies, the table below shows that most developed market stock markets have a high correlation. Over the past year, however, the Asian stock markets have had much lower correlation. This is partly down to the poor performance of the Chinese stock market this year following a boom last year. Emerging markets tend to have lower correlations with developed markets over longer time periods.
One-year geographical equity correlations | |||||||
|---|---|---|---|---|---|---|---|
| Name | FTSE All Share | FTSE Europe ex UK | MSCI AC Asia ex Japan TR in GB | MSCI Emerging Markets | MSCI World | S&P 500 | TSE TOPIX TR |
| FTSE All Share | 0.95 | 0.21 | 0.35 | 0.86 | 0.75 | 0.54 | |
| FTSE Europe ex UK | 0.95 | 0.12 | 0.28 | 0.90 | 0.80 | 0.63 | |
| MSCI AC Asia ex Japan | 0.21 | 0.12 | 0.97 | 0.19 | 0.10 | 0.36 | |
| MSCI Emerging Markets | 0.35 | 0.28 | 0.97 | 0.29 | 0.18 | 0.41 | |
| MSCI World | 0.86 | 0.90 | 0.19 | 0.29 | 0.97 | 0.69 | |
| S&P 500 | 0.75 | 0.80 | 0.10 | 0.18 | 0.97 | 0.60 | |
| TSE TOPIX | 0.54 | 0.63 | 0.36 | 0.41 | 0.69 | 0.60 | |
| Source: FE Analytics, 26.08.21, total returns in GBP | |||||||
Bonds
Inflation and the potential rise of interest rates is a risk for bond prices, so it is sensible that any government bonds have a low duration (ie a short period of time to maturity), perhaps with inflation protection also built in.
Sleep says that given the low returns from government bonds and corporate bonds, 7IM has shifted 4 per cent to 5 per cent out of these asset classes into emerging market bonds, and into equities. 7IM’s growth portfolio currently has 72 per cent of assets in equities with 22 per cent in fixed income, 4 per cent in property and 2 per cent in cash. He notes that in the last few downturns some of the emerging market bonds have performed quite well, for example in China where bonds are being held increasingly widely.
Boscher says Ravenscroft switched out of UK government bonds and into US Treasury Inflation-Protected Securities when inflation expectations picked up around nine months ago, with them also buying some emerging market debt.
Common mistakes
One key mistake to avoid, which crops up frequently in our portfolio clinics, is holding too many similar active funds. This can leave you effectively owning an expensive tracker fund. If you are going to own active funds, it is best to do so with conviction so you can reap the benefits if they perform well. They can always be complemented with passive exposure.
Boscher says that Ravenscroft’s balanced mandate might typically hold 15 to 20 funds in total. It is unlikely that a diversified portfolio should contain more funds than 20, and the more funds you have, the less likely you are to monitor them properly.
Khalaf points out you can also look at diversification from an absolute perspective, or relative to a benchmark, if you are concerned about performance against the index. For example, around two thirds of the MSCI World Index is currently invested in the US, which isn’t well diversified on an absolute basis. This is where private investors can have an edge over professional fund managers, as ultimately their performance is judged relative to a benchmark.