- Low leverage
- Margin improvements
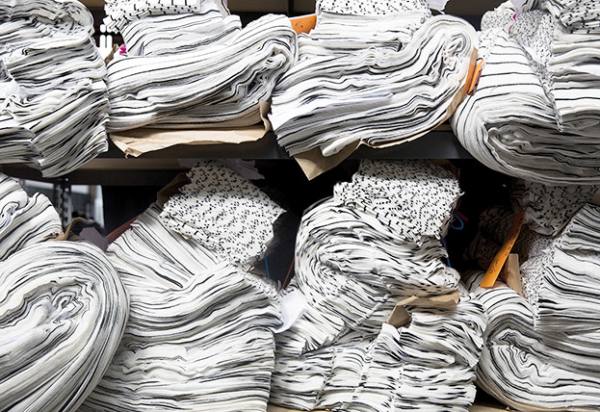
Labour is the most significant operational cost at Johnson Service Group (JSG), the linen services specialist. But in the year to the end of December, staff spending as a percentage of revenue fell to 44 per cent (from 47 per cent in FY2022).
Encouraging as this is, some challenges remain: the company is due to open a new site this year, while the minimum wage is due to increase in some markets. This could make it difficult to keep labour costs on their downward trajectory. There’s also continued energy price volatility to contend with.
Given these pressures, the group’s revenue and profit progress is impressive – but investors will also want to ensure it is sustainable in the longer term. Things look undeniably positive in JSG’s HORECA (hotel, restaurant and catering) business, where revenue was up almost 30 per cent to £323mn.
The division’s adjusted Ebitda was up 42 per cent to nearly £90mn, with margins expanding to around 28 per cent – from 25 per cent the previous year. Growth was slower in workwear, which provides rental and laundry services to corporations, with sales up 6 per cent in 2023.
On another positive note, the group managed to keep its leverage low despite making two acquisitions and initiating a share buyback last year. Net debt to Ebitda was 0.8 times at 31 December – well below management’s target of 1.0-1.5 times.
The shares currently trade at 14 times FactSet consensus earnings for 2024, which we think looks a little pricey given ongoing operational stresses. We’d like to see how the next few months play out before changing our stance. Hold.
Last IC View: Hold, 130p, 5 Sep 2023
| JOHNSON SERVICE GROUP (JSG) | |||||
| ORD PRICE: | 142p | MARKET VALUE: | £588mn | ||
| TOUCH: | 140-142p | 12-MONTH HIGH: | 147p | LOW: 99p | |
| DIVIDEND YIELD: | 2.0% | PE RATIO: | 22 | ||
| NET ASSET VALUE: | 67p* | NET DEBT: | 38% | ||
| Year to 31 Dec | Turnover (£bn) | Pre-tax profit (£mn) | Earnings per share (p) | Dividend per share (p) |
| 2019 | 351 | 38.1 | 8.40 | 1.15 |
| 2020 (restated) | 230 | -32.1 | -6.50 | nil |
| 2021 | 271 | 5.10 | 1.60 | nil |
| 2022 | 386 | 30.3 | 6.50 | 2.40 |
| 2023 | 465 | 37.6 | 6.40 | 2.80 |
| % change | +20 | +24 | -2 | +17 |
| Ex-div: | 11 Apr | |||
| Payment: | 10 May | |||
| *Includes intangible assets of £164mn, or 40p a share | ||||