Dani Rodrik, one of the half dozen or so superstars of economics, labelled it “mindless globalisation” – the mass export of blue-collar jobs from the rich world, where labour was expensive, to the poor world, where it was cheap.
According to Rodrik, now at Harvard University’s Kennedy School of Government, this process peaked in the late 1990s. Thereafter, additional dismantling of barriers to trade and attempts to push globalisation further seemed to be “motivated primarily by the objective of enriching certain groups rather than expanding the size of the overall pie”, he wrote last year in a paper on trade and inequality.
Rodrik had been banging on about globalisation’s downside since the 1990s without anyone beyond academia taking much notice. Nowadays, however, his views have become mainstream – trade is good, but more trade is not necessarily better and globalisation as an end in itself is probably downright bad.
As a result of its excesses, the consequences of globalisation are being worked through in the rich world – and how. But the process of moderating globalisation, in some respects even dismantling it, is also being felt in the emerging economies that were the main beneficiaries of the west’s fixation with lower trade barriers.
That is the panoramic backdrop to an assessment of the prospects for emerging markets and frontier markets in 2023 and well beyond. The data on globalisation’s moderation is as good a place as any to start; for which, refer to Chart 1. This shows the 30-year record to 2020 of exports as a percentage of output for the world, for low-and-middle income countries as a group, and for India and China, which is now the world’s biggest economy if output is measured by purchasing power in relation to domestic costs (so-called ‘purchasing-power parity’).
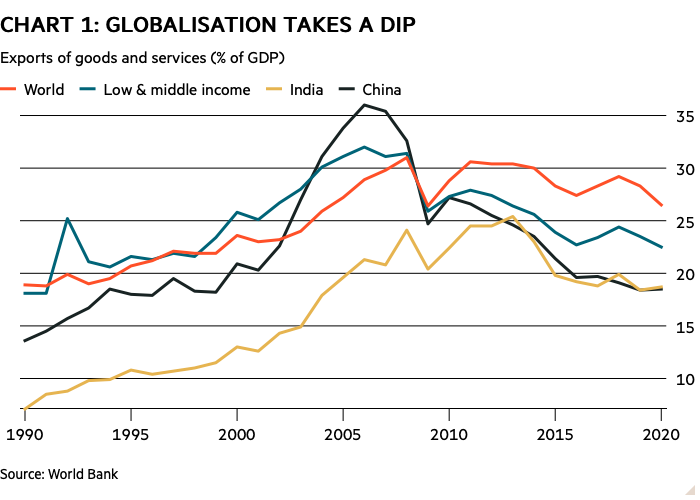
The chart shows clearly, and especially for China, how the contribution of exports to national output has been on a downward trend since the global financial crisis of 2008-09. In other words, international trade has become less important. In China’s case, the ratio has almost halved from a peak of 36 per cent in 2006 to 18.5 per cent in 2020 (the latest data available). Granted, for some emerging economies the trend is still upwards; Vietnam, for example, where the value of exports has climbed relentlessly since 1990 and has exceeded the value of national output every year since 2017. However, countries such as Vietnam are the exception and the direction of travel is indisputable.
To an extent, moderation of exports in relation to output is to be expected, especially in China’s case. Its output, approaching $15tn (£12.4tn) in 2020, was five times bigger than in 2006. So the halving of the ratio of exports to GDP over the period 2006-20 disguised a doubling of revenue generated from exports.
Besides, this moderation is also a proof that globalisation has done its job, especially for a substantial proportion of Asia. It has pulled poor parts of the globe out of poverty, to the extent that domestic consumption becomes a big driver of national output as discretionary consumer spending overwhelms subsistence spending. Aside from China, low-to-middle income countries have done well on average and Vietnam is a notable performer.
The exceptions to the rule have been the economies of sub-Saharan Africa. The performance of the ‘rainbow nation’ – Desmond Tutu’s epithet for post-apartheid South Africa – has been more like a washout. In the 20 years to 2020, South Africa has lost 26 per cent of its per-capita output relative to the global average. Put another way, in 2000 South Africa produced almost three times China’s per-capita gross domestic product (GDP); by 2020 it produced 22 per cent less than China.
The short-term outlook
More about Africa and the long-term trends for emerging markets – the trends that investors should really follow – in a moment. But because investing is also about the here and now, what about the outlook for emerging markets in 2023? Table 1 puts that into a global context, using data from the International Monetary Fund (IMF), including its forecast for GDP growth in 2023.
| TABLE 1: GLOBAL GROWTH, WHENCE IT CAME, WHERE IT MAY GO | ||||||
|---|---|---|---|---|---|---|
| Real GDP (% change on year) | 2004-13 | 2014-19 | 2020 | 2021 | 2022e | 2023e |
| World | 4.1 | 3.4 | -3.0 | 6.0 | 3.2 | 2.7 |
| Advanced economies | 1.6 | 2.1 | -4.4 | 5.2 | 2.4 | 1.1 |
| USA | 1.8 | 2.4 | -3.4 | 5.7 | 1.6 | 1.0 |
| United Kingdom | 1.2 | 2.2 | -9.3 | 7.4 | 3.6 | 0.3 |
| Emerging & Developing economies | 6.4 | 4.4 | -1.9 | 6.6 | 3.7 | 3.7 |
| Emerging Asia | 8.5 | 6.5 | -0.6 | 7.2 | 4.4 | 4.9 |
| Emerging Europe | 4.3 | 2.5 | -1.7 | 6.8 | 0.0 | 0.6 |
| Sub-Saharan Africa | 5.6 | 3.2 | -1.6 | 4.7 | 3.6 | 3.7 |
| China | 10.3 | 6.8 | 2.2 | 8.1 | 3.2 | 4.4 |
| India | 7.7 | 6.8 | -6.6 | 8.7 | 6.8 | 6.1 |
| Brazil | 4.0 | -0.3 | -3.9 | 4.6 | 2.8 | 1.0 |
| Source: International Monetary Fund; 2004-13 and 2014-19 average rate per year | ||||||
The table quantifies two standout points that are worth underlining even though they are familiar.
● Emerging markets have consistently grown faster than both the global average and developed economies since the turn of the century
● Even though their pace of growth is on a downward trend, it remains, and is expected to remain, faster than the developed world.
Sure, the IMF’s forecasts for 2023 come with more than the usual amount of caution. The global lender of last resort says “the balance of risks is firmly tilted to the downside”, with a one-in-four chance that growth in global output will be less than 2 per cent. If that materialised, it would make 2023 one of the worst five years for growth – or lack of it – since 1970.
To some extent, this is the so-called ‘availability heuristic’ at work – the well-observed tendency of people, economists included, to exaggerate the chances of something bad happening simply because bad stuff is much on their minds. Thus, in a world recovering from a pandemic, caught in global supply foul-ups and reeling from soaring energy prices, it is only natural to see more misery rolling in.
Consistent with that, the IMF has hacked back its forecasts for 2023’s growth rate. For world output, its latest guesstimates are a quarter less than eight months earlier. It now suggests global output will grow at 2.7 per cent in 2023, which is 0.9 percentage points less than its April estimate. Possible growth in advanced economies is cut back by more than half to just 1.1 per cent. In comparison, emerging markets are super resilient. For them, the IMF has reduced its estimate by just one sixth and suggests that, in aggregate, they will grow by 3.7 per cent on the year.
Naturally, there are tough players and weaklings among these. Arguably most resilient – though say it quietly – is Russia, whose output estimate for 2022 has been bumped up by 5.1 percentage points since April. Even so, the IMF still expects Russia’s economy to shrink by 3.4 per cent in 2022 followed by another 2.3 per cent shrinkage in 2023.
Russia’s resilience has everything to do with the global price of oil and gas, which is also the underlying reason for the comparative success of Latin America in 2022. The IMF’s estimate for the region’s 2022’s output is a percentage point higher than its April forecast and for Brazil, its biggest economy, the estimate was raised by two points. That said, the IMF also thinks Latin America’s outperformance will fade in 2023. Brazil’s output may rise by only 1 per cent, despite the optimism engendered by the result of its October presidential election, and by 1.7 per cent for the entire region.
As usual, emerging markets’ growth will be driven by what happens in Asia, particularly India and China. In percentage terms, India again looks like being the star. The IMF has trimmed its 2023 forecast for India’s growth by about an eighth, but it still expects a 6.1 per cent uplift. It has cut its forecast for China’s 2023 growth by a slightly bigger fraction and now puts 4.4 per cent as the number. If it happens, that will at least be usefully higher than the 3.2 per cent growth likely for 2022. Barring 2020’s Covid-hit year, 2022 will produce the lowest growth rate China has recorded in more than 40 years.
When the US sneezes...
Yet these estimates remind us that, in the bigger scheme of things, emerging markets are not masters of their own destiny. In particular, a major determinant of their performance is what happens in the US. An element of this is encapsulated in Chart 2. This compares 12-month changes in the value of the US dollar against a basket of currencies with the 12-month performance of emerging market equities as measured by the MSCI Emerging Markets index, a 1400-stock $6.4tn barometer of investor sentiment towards the developing world.

In general, as one of these variables rises, the other falls. The chart shows this, although in a fuzzy way because movements in an equity index are much more volatile than changes in a currency. The clearest example of contrasting fortunes is the response to the global financial crisis of 2008-09, when a dash for the safety of the US dollar coincided with dumping emerging market stocks. It is also evident during the 2010s as the sustained recovery of emerging markets is mirrored by the steady decline of the dollar.
The pattern has been repeated from 2020 to the present as a rising dollar once again coincides with falling emerging market indices. This is logical since a strong dollar puts an additional burden on borrowers in developing economies – both governments and companies – who have raised dollar-denominated debt. In effect, their debt-servicing costs rise. When this is accompanied by higher dollar interest rates, the cost of dollar debt can be overwhelming and in 2022 US interest rates rose faster than any time in history.
Increasingly, markets feel that the Federal Reserve, the US central bank, has done enough to drive out excess inflation. If so, that’s good, but it just prompts a subsequent question: when will growth resume? Put another way, will the recession, which has officially started in the US and is soon to start in the UK, be short or long?
One sensible answer is, it does not really matter. Engrossing though that question currently seems, in the long run it is unlikely to be that important. Bigger factors will shape the performance of developing economies and, by and large, they are not too encouraging.
For starters, let’s quantify what we have already mentioned – that long-term growth rates for developing economies are slowing. Chart 3 does this with data from 1980 onwards. It shows the five-year rolling average growth rate in inflation-adjusted GDP for three of the biggest emerging economies. Using the rolling average smooths the year-on-year bumps and blips, giving a better picture. As a result, both Brazil’s and India’s growth rates are almost always anchored within a four percentage point band – zero to 4 per cent in Brazil’s case and 4 per cent to 8 per cent for India. Brazil’s trend is more down than up. For India, deceleration isn’t certain, although it is hard to see how the country can return to its five-year growth rates of the early 2000s, which were consistently above 8 per cent.

For China, however, the slowdown is both well-known and understandable. No country can expect to maintain the growth rate China achieved for much of the 30 years to around 2010. To put that into context, in 1977 Deng Xiaoping, then China’s leader, famously – and metaphorically – declared that so long as a cat catches mice then it’s a good cat. With that he set rolling perhaps the greatest economic transformation for the greatest number of people ever seen – cats could catch mice and even good communists could become wealthy.
At a guess, China’s per capita output in 1977, measured in today’s dollars, was about $300 a year, barely even subsistence level. In 2021 it was approaching $19,500, or the global average. If it continued growing at around the 12 per cent it managed for much of the 1980s and 1990s, by 2033 the typical Chinese would be as wealthy as the average American. Put simply, that isn’t going to happen.
As to why not, it’s not glib to suggest the world would struggle to process enough resources to make 1.4bn Chinese as wealthy as 330mn Americans. Closer to reality, China faces too many hurdles. These range from, for example, coping with the debt crisis that, one day, must result from spending so much capital on so many infrastructure projects that remain so little used, to building the welfare state that China’s middle classes will demand if they are to sustain domestic demand. That project, of course, will require higher taxes, the extraction of which will apply all sorts of new pressures onto an authoritarian system.
Demographic demands
Yet the tallest hurdle is illustrated in the adage that ‘demographics is destiny’. Assuming that’s true, then China is likely to fulfil the notion that it will get old before it gets rich. Largely as a result of its one-child policy, which dates from the 1980s, China has arguably the world’s worst demographic profile. Not only is the imbalance between the sexes sufficient to lead to political unrest, but also the demographic dividend that was the major factor behind its escape from poverty is now spent. By 2050, the age profile of China’s population, as measured by its median age, will make the UK’s look spritely.
To a lesser extent, other developing nations will face the same dilemma. Take Brazil: by 2050 its population profile will be three years older than the UK’s profile today, so good luck with continuing to run a developed world’s state pension system on a developing country’s income when that comes around.
Meanwhile, in much of sub-Saharan Africa the demographic challenge is reversed – on average, the population is too young. Take Africa’s most populous nation, Nigeria, where the median age is 17, the same as it was 50 years ago. The effect is that the child dependency ratio is almost as burdensome as the old-age dependency ratio that weighs on the developed world.
Sure, this provides a pool of young, cheap and mostly unqualified labour, but that is not necessarily what the likes of Nigeria need. Partly that is because they lack the planning and financing to build the projects that can provide lots of low-skilled manufacturing jobs. Partly it is because chunks of the developing world – especially in Latin America and sub-Saharan Africa – suffer what Harvard’s Rodrik has labelled ‘premature de-industrialisation’.
This is where a country’s manufacturing base starts to shrink even though its level of per-capita income is far below the level at which advanced economies started to de-industrialise. For developing countries, this is a big problem because low added-value manufacturing is so important for their progress out of poverty. It can employ lots of workers and is mostly export-orientated, which means it can keep adding jobs even when domestic demand is stagnant.
Why it happens remains unclear partly because, according to Rodrik, it has not affected the emerging economies of Asia. However, more mechanisation might be the problem. In other words, more sophisticated capital goods can substitute for even the cheapest workers. So, unable to offer their pool of cheap labour productive jobs in manufacturing, newly developing countries can do no better than offer a smaller number of comparatively unproductive jobs in low-level service industries. What it means is that the conventional route out of poverty has been shut off.
Which seems a depressing note on which to finish. The effects of global stagflation in the short term, demographic dead ends and de-industrialisation longer term, what’s good about investing in emerging markets? Indisputably, the excitement they offered in the 1990s has gone. Today the ‘Bric’ nations no longer offer much to build on; no one imagines that China will seamlessly meld into the global capitalist order; no one will be taken seriously – as was the political scientist, Francis Fukuyama in the early 1990s – if they pronounce global political struggle dead, euthanized by western liberalism.
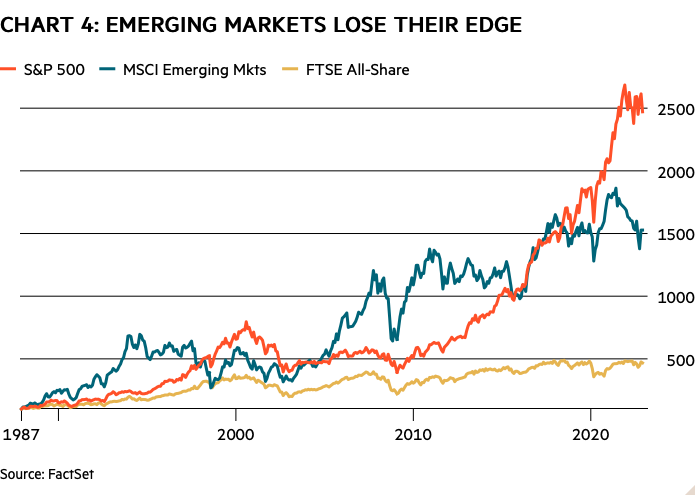
More prosaically, and as Table 2 and Chart 4 show, the performance of emerging market equities has not been that great since the 1990s. Even the outperformance of the UK’s FTSE All-Share index by the MSCI Emerging Markets index would be less pronounced if our database offered total returns (the effect of dividends as well as capital gains) stretching back 30 years.
| TABLE 2: FALTERING DEVELOPMENT | |||
|---|---|---|---|
| % change on* | MSCI Emerging Mkts | S&P 500 | FTSE All-Share |
| 1 year | -10 | -8 | -3 |
| 5 years | -5 | 64 | -4 |
| 10 years | 26 | 269 | 32 |
| 20 years | 350 | 493 | 115 |
| 30 years | 293 | 1,026 | 198 |
| * index return in sterling as at 13 Dec 2022. Source: FactSet | |||
Yet let’s remind ourselves of the data in Table 1. Emerging and developing economies have consistently grown faster than mature economies for the past 30 years. That trend is expected to persist, even if the pace of the outperformance continues to moderate as China gets older and more affluent. Capturing that excess growth via equity returns seems like a sensible pursuit.
Therefore, think of emerging markets not as an exotic form of investing, but as a basic part of the exercise of diversifying sensibly. Thus a portfolio that aims to be diversified both by geography and by type of asset only achieves that when it has continuous exposure to emerging economies, probably via a product as unimaginative as a general purpose emerging markets exchange-traded fund. Not very glamorous, that’s true. Then again, the glamour of emerging markets was always best left to Rudyard Kipling on the road to Mandalay.