
The cost of renting a home in the UK is rising at a pace that is hard to overstate. In May 2022, the annual rate of rental growth was the fastest ever recorded though still only 2.8 per cent. The figure may not look dramatic but the trend is as important as the raw data. In every consecutive month since then, that record has been broken again, with the data for this July showing rent increasing at 5.3 per cent a year.
- Surging demand for rented homes
- Partnership with TfL
- Potential for higher dividends
- Values solid despite interest rates
- High leverage
- Share price close to NAV
True, the UK data only goes back to 2016, but for England the data goes back to 2006, and those numbers reveal much the same: July marked the 10th consecutive month for record annual rent increases. It is a similar story in Wales, Scotland, Northern Ireland and in every region of England. Even in London, where rental growth is often more elevated, July saw the fastest rent increase on record, breaking a high-water mark set in June 2012.
In other words, this is not just a one-off, but an unprecedented upwards trend that's happening in every geographical area in the UK. The trend also looks unlikely to go away quickly. While causes of the demand for rental property are tough to pin down, with some pointing to record-high immigration figures as an explanation, what is certain is that supply is too low, with an already-existing housing shortage made worse by high inflation, and interest rates, stricter legislation and alternative revenue streams pushing buy-to-let landlords out of the market.

Grainger (GRI) is ready to service this demand, as it has been doing for decades. The residential landlord traces its history back to 1912. As such, it offers a very different investment case to the relatively new PRS Reit (PRSR), which is a young externally-managed real estate investment trust building up its portfolio through acquisitions and offering affordable rental houses for families.
By contrast, Grainger is a well-established internally managed player, which is not yet a Reit, and already has a sizable portfolio, to which it is adding through further development. It targets mid-market renters with the offer of city centre living, typically in London.
All Reit in the end
Grainger’s progress towards Reit status could be a straightforward win for income investors. Any investor who buys in now is likely to benefit from a dividend bump if Grainger changes structure in the next two-and-a-half years, as planned, because Reits are legally obliged to hand out 90 per cent of their taxable income as dividends.
The change would also make Grainger the only true build-to-rent (BTR) Reit in the UK. PRS Reit does not build its properties, and stylistically speaking BTR tends to refer to the sort of urban blocks of flats Grainger develops rather than the homes PRS Reit buys. Other Reits develop BTR, but only Grainger specialises in doing it.
Grainger’s unique offering, and the prospect of a return on investment in BTR development, is enticing because the asset class is going through the kind of boom that rental prices imply. But the sub-sector is not just in line with the market: rents for BTR properties are rising faster still, which perhaps speaks to the quality of the properties.
According to estate agent Savills, average BTR rents jumped 10.4 per cent annually in the second quarter of 2023, double the general increase in average residential rents. Grainger, with its focus on the London BTR market, clocked a 12 per cent increase in net rental income in the year to 30 June.
These inflation-beating rental returns have institutional investors tripping over themselves to buy BTR stock. Despite interest rates driving down values and reducing investment activity in the rest of the commercial real estate sector, Savills’ data reveals BTR recorded its best second quarter on record this year in terms of BTR investment volumes – following on from a fourth-consecutive record-breaking year in 2022.
The frenzied demand for BTR assets from investors and occupiers has helped prop up Grainger’s values despite higher interest rates causing issues in for the real estate market. Since last June, Grainger’s net asset value (NAV) has dropped a mere 2.2 per cent as its Reit competitors’ NAVs have cratered.
The strategy behind Grainger’s above-average performance in such a hot sector is to be the first mover in a given well-connected area, usually in London. For example, the developer likes to build new flats next to a London tube or train station before anyone else. It then likes to cluster new developments around existing successful sites to increase efficiency. Its partnership with Transport for London (TfL) to build 1,240 homes over the next three years on TfL land will only help with this plan.
TfL is not Grainger’s only route to growth, though. The landlord has the potential to expand into the regions and hinted in its results that such a shift would generate even better returns. Its regional portfolio “outperformed London marginally”, the company said in its half-year results in May. It does not mean returns in London are sub-standard, but it’s encouraging that the company is considering its options.
The cat’s out of the bag
One problem for Grainger as an investment case is that the market has already reacted to these signals. As such, the company’s shares trade at more or less the same price as its NAV. Since shares in most other Reits trade at wide discounts, it is worth asking whether Grainger offers as good value as its peers. Our view is that quality comes at a price, and buying in now still offers the prospect of future NAV growth as Grainger expands: the company currently trades on a discount to forward NAV of 12 per cent.
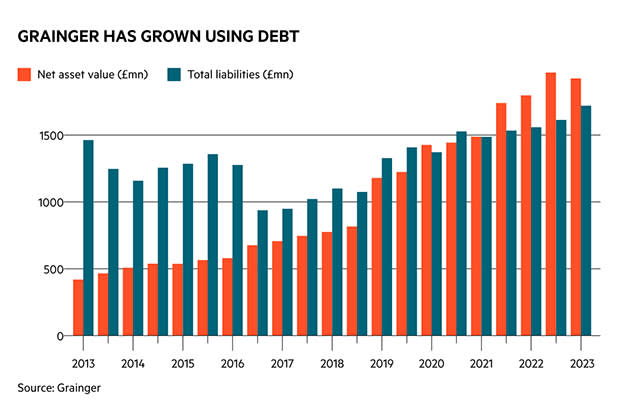
The other issue is net debt. At 72 per cent of net assets, the ratio is much higher than many other Reits and does not give it as much headroom as its rivals to borrow more for further growth. It could take a page out of Unite’s (UTG) book and go for an equity raise. Given Grainger operates in a popular niche, it’s easy to argue that it could raise money, not that this would necessarily be popular with its shareholders. Either way, a lower debt position would be preferable for the company now that the cost of borrowing is at levels not seen in years, especially considering how much of its past growth has been funded by cheaper debt (see chart).
Then there’s the complexity of what is currently driving the current rental surge. It is difficult to pin down any single cause, meaning the trend could switch if something changes. Office for National Statistics data shows that it is not uncommon for rents in London to flatline or fall. The London market generally swings to wider extremes than the regions, which is helpful for the London-focused Grainger when rents are rising, as it books the best of those increases. Should London growth go into reverse, Grainger might suffer.
The final concern is competition. As Savills’ BTR investment figures show, Grainger is not the only company spending money in this sub-sector. Private equity, with its seemingly bottomless pockets, has been throwing money at the sector for years, and the largest BTR players in the UK are private, not listed. Private equity tends to take more risks and can be more aggressive when it comes to expansion. That might make it harder for Grainger to continue its first-mover advantage.
However, another way of looking at the money piling into the sector is that it suggests Grainger, with its already sizable portfolio, has been in the right place for years and is now starting to reap the benefits. We believe investors stand to benefit, too.
| Company Details | Name | Mkt Cap | Price | 52-Wk Hi/Lo |
| Grainger (GRI) | £1.61bn | 218p | 298p / 203p | |
| Size/Debt | NAV per share | Net Cash / Debt(-) | Gearing | 5yr NAVps CAGR |
| 265p | -£1.38bn | 72% | 10.3% | |
| Valuation | Disc/Prem Fwd NAV (+12mths) | Fwd PE (+12mths) | Fwd DY (+12mths) | FCF yld (+12mths) |
| -12% | 28 | 3.5% | - | |
| Forecasts/ Momentum | Fwd NAV grth NTM | Fwd NAV grth STM | 3-mth Mom | 3-mth Fwd NAV change% |
| - | 3% | -10.3% | 0.1% | |
| Year End 30 Sep | Profit before tax (£mn) | EPS (p) | DPS (p) | |
| 2020 | 78.5 | 10.2 | 5.46 | |
| 2021 | 99.2 | 9.9 | 5.14 | |
| 2022 | 80.6 | 10.2 | 5.89 | |
| f'cst 2023 | 71.3 | 7.5 | 6.50 | |
| f'cst 2024 | 80.5 | 8.2 | 7.52 | |
| chg (%) | +13 | +9 | +16 | |
| Source: FactSet, adjusted PTP and EPS figures | ||||
| NTM = Next Twelve Months | ||||
| STM = Second Twelve Months (i.e. one year from now) | ||||